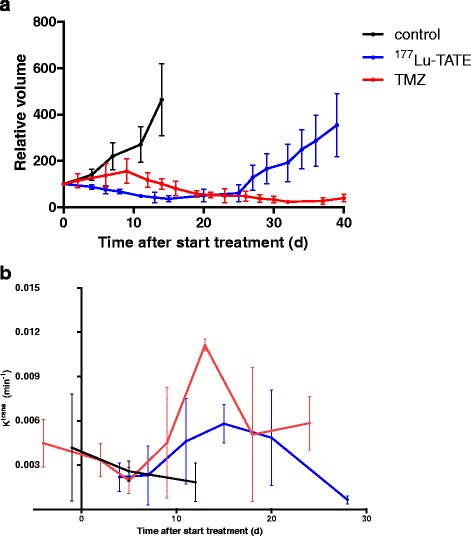
Fig. 3.

Effect on H69 tumour volume (a) and tumour perfusion (b) of single-agent treatment. a Tumour volume as a percentage compared to day 0 ± SD. b Average intra-tumoural ktrans was calculated, and the presented data show the average across tumours with the SD. The control group (n = 3) (black line) received saline, the PRRT group (n = 4) was treated with 50 MBq 177Lu-TATE (blue line) on day 0, and the temozolomide (TMZ) group (n = 7) (red line) was treated for 14 days with orally administered TMZ at a dose of 50 mg/kg/day
