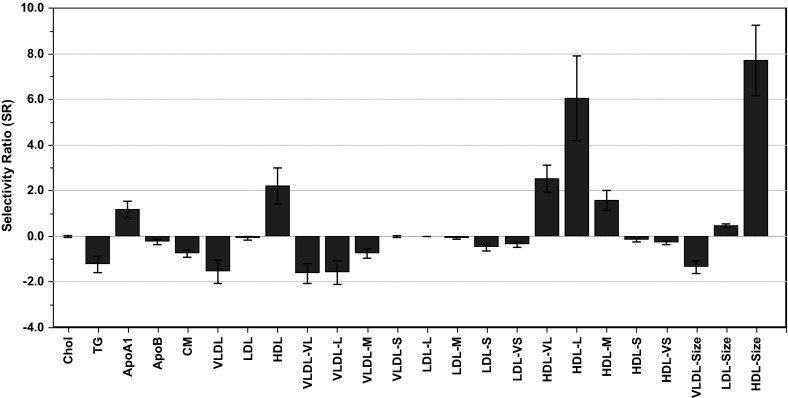
Fig. 1.

Selectivity ratio (SR) plot showing gender differences in lipoprotein patterns. Features with positive sign on SR are higher in women, while features with negative signs on the SRs are higher in men. The confidence limits around each feature are obtained from RDCV
