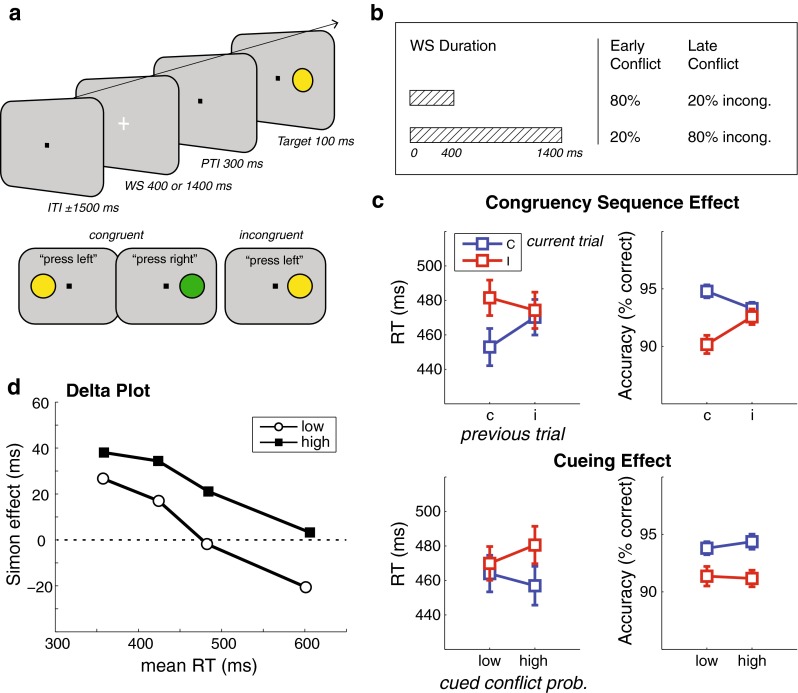
Fig. 1.

Task paradigm and behavioral results. (a) Trial types, stimulus sequence, and timing (top), and examples of congruent and incongruent trials (bottom). (b) The proportions of congruent/incongruent trials depended on the duration of the warning signal (WS). (c) Reaction times (RTs, left) and accuracy (right) for congruent (C) and incongruent (I) trials as a function of previous trial congruency (top) and cued conflict probability (bottom). Error bars represent ±1 SEM. (d) Delta plot showing conflict effects (current trial RT incongruent – congruent) as a function of quartiles of the RT distribution, for both low (white open circles) and high (black solid squares) conflict probability, collapsed over groups (i.e., irrespective of WS duration)
