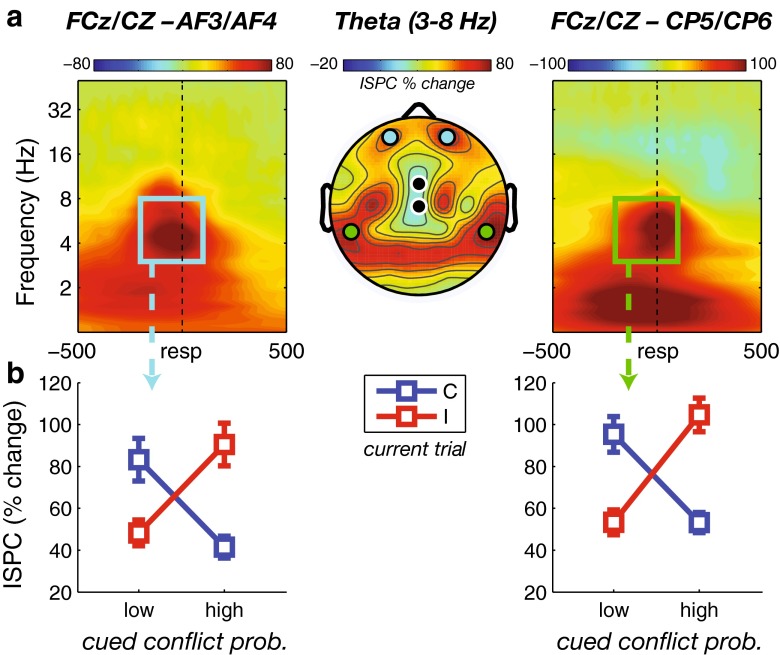
Fig. 3.
Response-locked intersite phase clustering (ISPC) results. (a) Topographical map of condition-averaged midfrontal-seeded theta ISPC (middle), revealing connectivity between midfrontal and lateral prefrontal (AF3/AF4, left) sites and posterior (CP5/CP6, right) sites around the response. The outline box on the left and the top electrode disks in the map denote the time–frequency–space selection for lateral frontal connectivity; the box on the right and the bottom electrode disks denote time–frequency–space selection for posterior connectivity. The black disks in map depict the seed region of midfrontal FCz/Cz sites. (b) Average theta ISPC in the time windows denoted in panel a (as indicated by the arrows), plotted for congruent (c) and incongruent (I) trials as a function of cued conflict probability, for the respective target regions (left, AF3/AF4; right, CP5/CP6) showing connectivity with the midfrontal seed region. Error bars represent ±1 SEM

