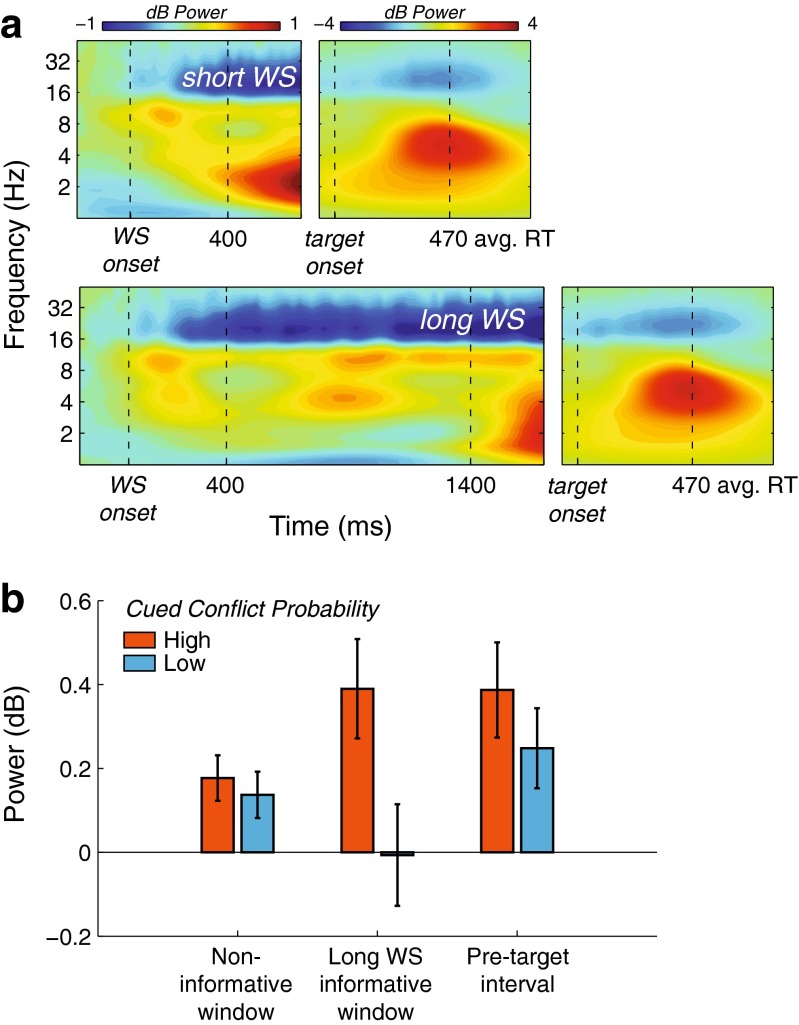
Fig. 4.
Cue-locked pretarget power results. (a) Condition-average time–frequency maps of midfrontal power, plotted separately for short-warning-signal (WS; top) and long-WS (bottom) trials. Activity is plotted separately for the pretarget (left; time relative to WS onset) and posttarget (right; time relative to target onset) periods due to scaling differences. Vertical dashed lines demarcate the time windows of interest, reflecting short- and long-WS onset and offset, target onset, and average RT. (b) Bar plot of average midfrontal theta power during three time windows of interest, separately for high and low cued conflict probability in the noninformative window (0–400 ms post-WS), informative window (400–1,400 ms post-WS; long-WS trials only), and pretarget interval (–300 to 0 ms pretarget). Error bars represent ±1 SEM

