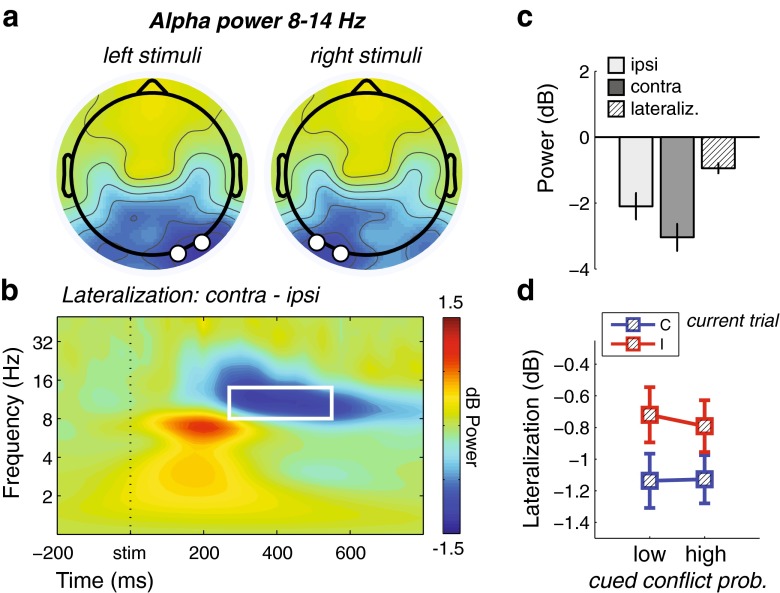
Fig. 5.
Stimulus-locked alpha lateralization results. (a) Topographical maps of alpha (8–14 Hz) power 300–600 ms poststimulus, plotted separately for stimuli presented to the left and right of fixation, showing contralateral posterior alpha suppression. The black-and-white disks denote the electrode selection for further analysis: PO8/O2 for left stimuli, and PO7/O1 for right stimuli. (b) Time–frequency map of contralateral minus ipsilateral activity (averaged over left and right stimuli), confirming modulation in alpha-band activity as a function of stimulus location. The white-line box denotes time–frequency window used for the ANOVA. (c) Bar plots of ipsilateral (light gray), contralateral (dark gray), and contralateral–ipsilateral (lined) posterior alpha power. (d) Average power of the time–frequency window denoted in panel b, plotted for congruent (C) and incongruent (I) trials as a function of cued conflict probability. Error bars represent ±1 SEM

