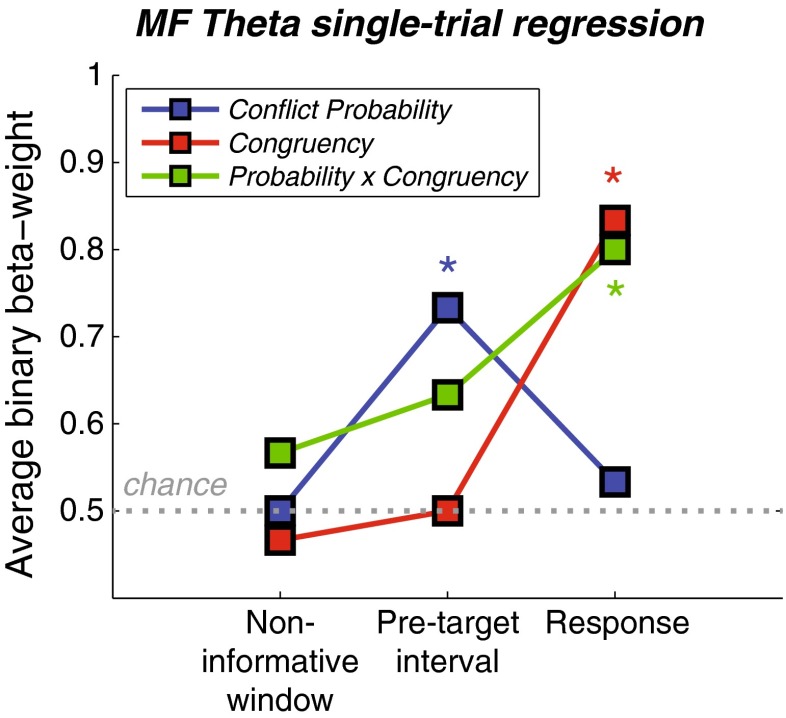
Fig. 7.
Single-trial midfrontal theta regression results. Plotted are subject-average binary beta weights (0 = negative prediction, 1 = positive prediction) as a function of time window, shown separately for the trial-type predictors conflict probability, congruency, and their interaction. Regression models including these three predictors were fitted per time window, on the single-trial midfrontal theta power averaged over the respective time window. The gray dotted horizontal line denotes chance prediction by the model. Colored asterisks denote significant regressions between single-trial theta and trial type (Wilcoxon rank sum t tests, p < .017)

