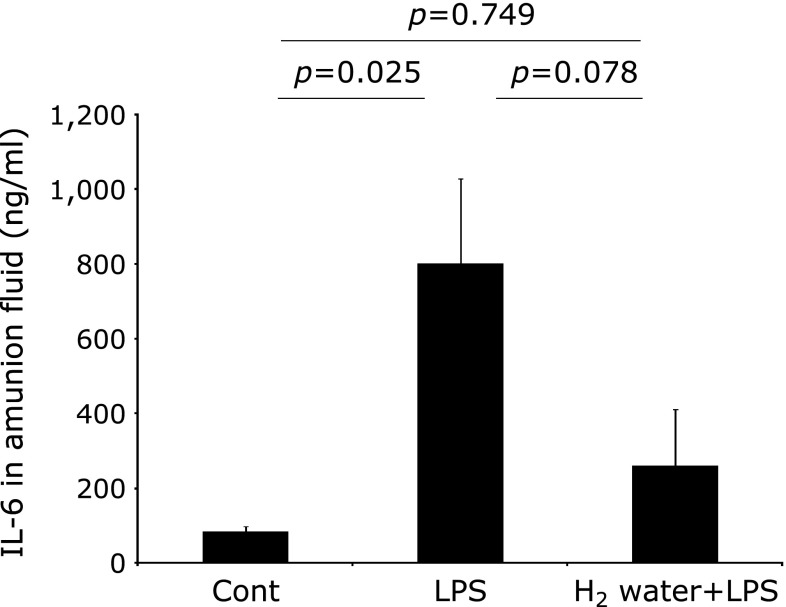
Fig. 1.
IL-6 proteins in the amniotic fluid. The results are expressed as the means ± SEM (n = 6). IL-6 in the amitotic fluid showed a tendency to decrease in the H2 water + LPS group compared with that observed in the LPS group. The p values were calculated according to the Student’s t test (Cont vs LPS) and the Mann–Whitney test (LPS vs H2 water + LPS and Cont vs H2 water + LPS, respectively. Cont = PBS i.p. control group, LPS = LPS i.p. injected group, H2 water + LPS = maternal H2 water intake prior to LPS i.p. injection.

