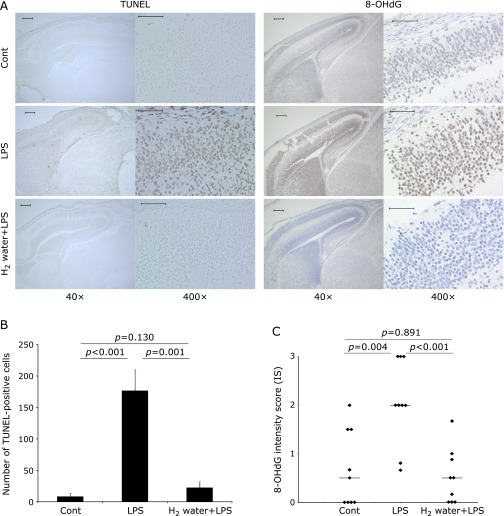
Fig. 3.
(A) Representative data for TUNEL staining (left columns) and immunohistochemical staining for 8-OHdG (right columns) of fetal brain tissue. Number of TUNEL positive cells and intensity score of 8-OHdG were significantly increased in the LPS group compared with the control group, but these induction was completely attenuated in the H2 water + LPS group. The original magnification is 40× (scale bar = 200 µm) in the left side and 400× (scale bar = 50 µm) in the images on the right side, respectively. The arrows indicate cells positive for TUNEL, an apoptotic marker, or 8-OHdG, a marker for oxidative damage on DNA. (B) The TUNEL positive cells were quantified and presented as the mean ± SEM. P values were calculated according to the Mann–Whitney test. (C) 8-OHdG staining was scored as intensity score (IS) and is presented as the mean ± SEM. The p values were calculated according to the Mann–Whitney test (Cont vs LPS and Cont vs H2 water + LPS) or the Student’s t test (LPS vs H2 water + LPS). Cont = PBS i.p. control group, LPS = LPS i.p. injected group, H2 water + LPS = maternal H2 water intake prior to LPS i.p. injection.

