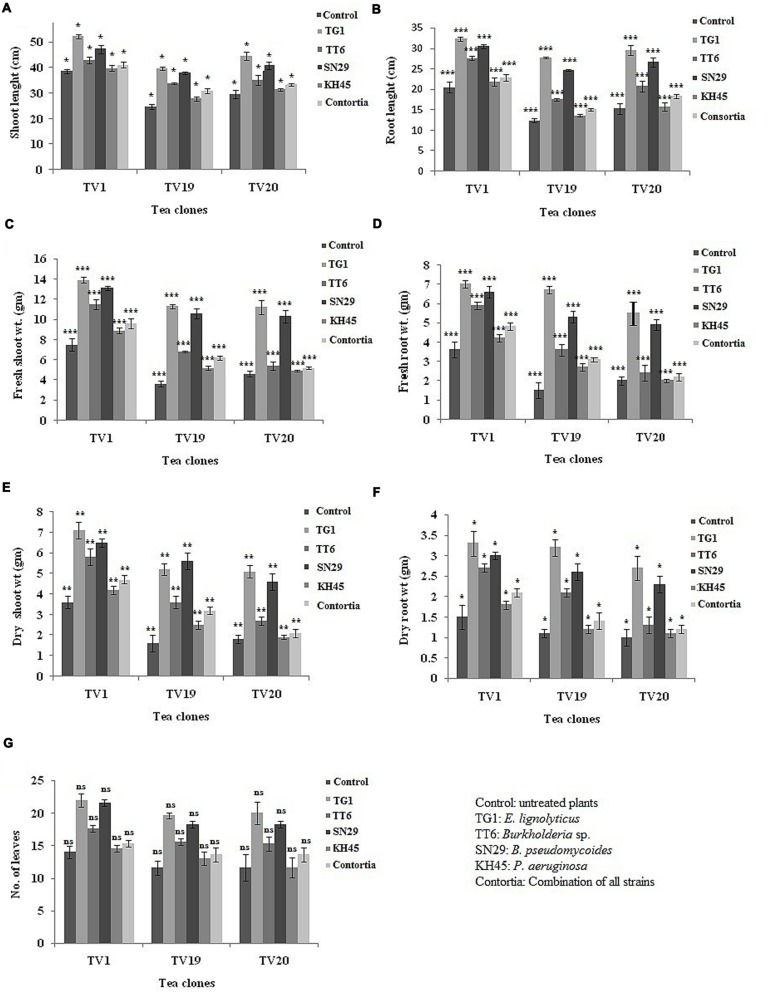
FIGURE 8.
Evaluation of greenhouse plant growth promoting experiment to show the effect of treatments in three tea clones TV1, TV19, and TV20 for (A) shoot length, (B) root length, (C) fresh shoot weight, (D) fresh root weight, (E) dry shoot weight, (F) dry root weight and (G) number of leaves. (∗P-value 0.05–0.01, ∗∗P-value 0.01–0.001, ∗∗∗P-value less than 0.001 and nsP-value greater than 0.05; see Supplementary Table S3).

