Figure 3.
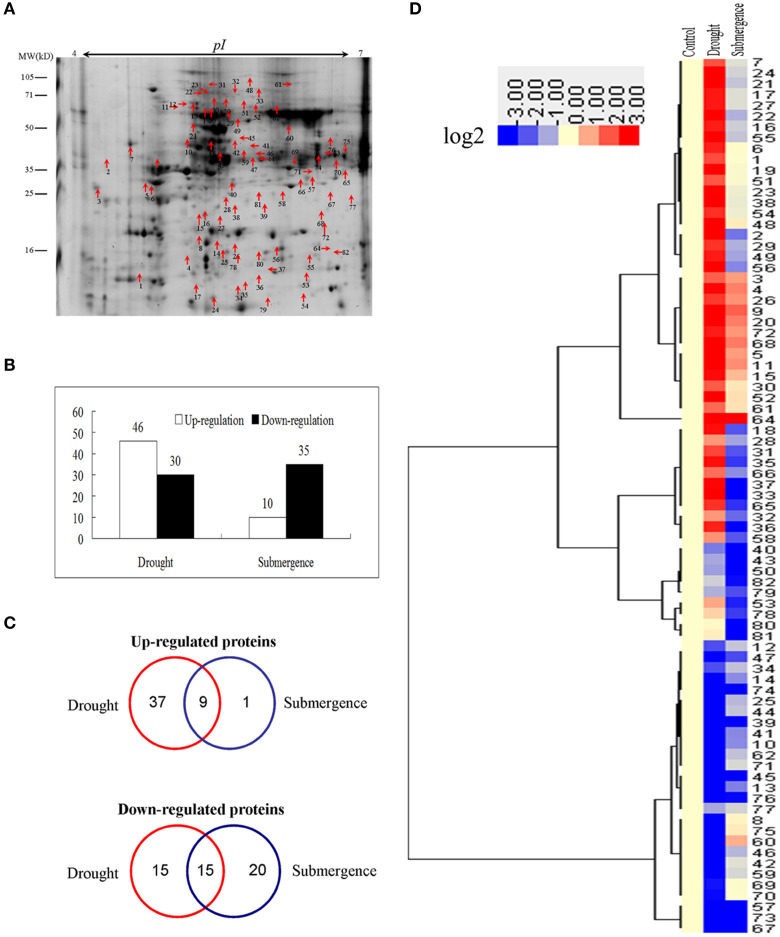
Proteins changed by drought and submergence. (A) A sketch map to show proteome patterns of bermudagrass in responses to drought and submergence. The protein spots induced at least two folds by drought and submergence were marked with arrows. Proteins were separated in the first dimension on the IPG strip (pH 4–7), and in the second dimension on 12.5% SDS-PAGE. (B) Total number of proteins changed by drought and submergence. (C) Venn diagram showing the number and of proteins that overlapped among three types of drought and submergence. (D) Hierarchical cluster analysis of proteins modulated by drought and submergence treatments. Resulting tree figure was displayed using the software package and Java Treeview. The detailed protein information was listed in Table S1.

