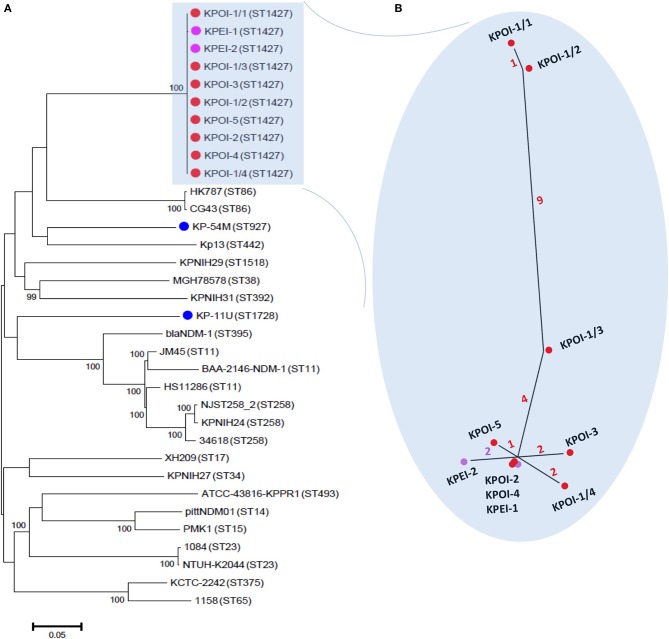
Figure 2.
Core-genome phylogenetic analysis of K. pneumoniae. (A) A maximum likelihood tree was constructed based on alignments of 4.4 Mb genomes which were defined as the core genomes in this study. The tree was rooted at the midpoint. The percentage of the supported bootstrap (>90) is shown. The isolates sequenced in this study are marked by dots colored red (patients involved in the outbreak), purple (environmental isolates), and blue (unrelated patients). The genomes of unmarked isolates were retrieved from GenBank. Sequence types of isolates are indicated between brackets. (B) The inset shows a close-up of the unrooted maximum likelihood phylogenetic tree of outbreak isolates based on 21 reliable SNPs as described in the text. The number of SNPs is indicated on the branches by different colors.

