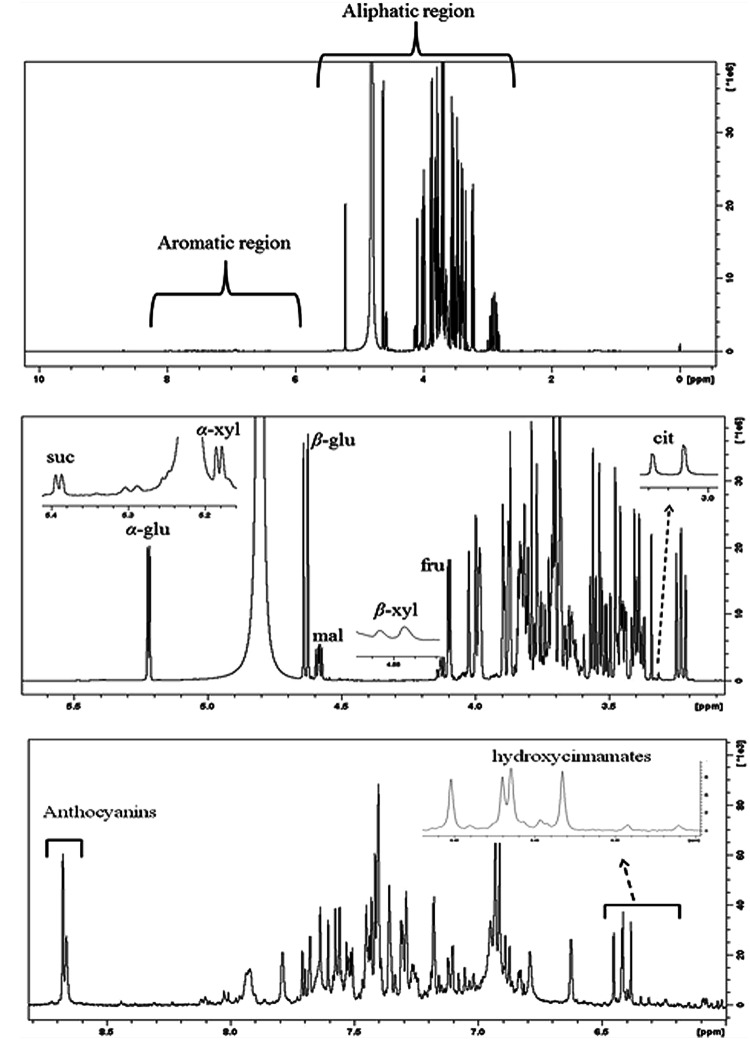
FIGURE 8.
(A) Typical 500 MHz 1H-NMR spectra of “Canada Giant” sweet cherry at harvest. (B) Aliphatic and (C) aromatic region of the 1H-NMR spectrum. Diagnostic peaks of some metabolites are labeled. α-glu: α-glucose, β-glu: β-glucose, fru: fructose, suc: sucrose, α-xyl: α-xylose, β-xyl: β-xyl, mal: malic acid, cit: citric acid.

