Figure 5.

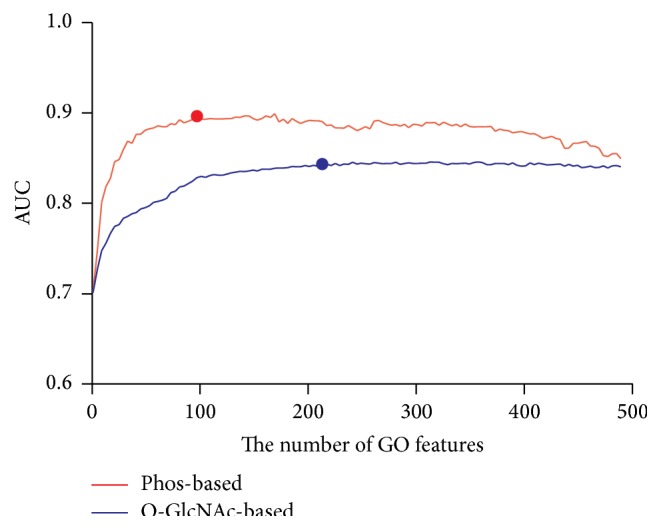
Comparison of ROC curve with different number of GO features. x-axis represents the number of ranked GO features added to sequence features, and y-axis represents the AUC of the corresponding models.

Comparison of ROC curve with different number of GO features. x-axis represents the number of ranked GO features added to sequence features, and y-axis represents the AUC of the corresponding models.