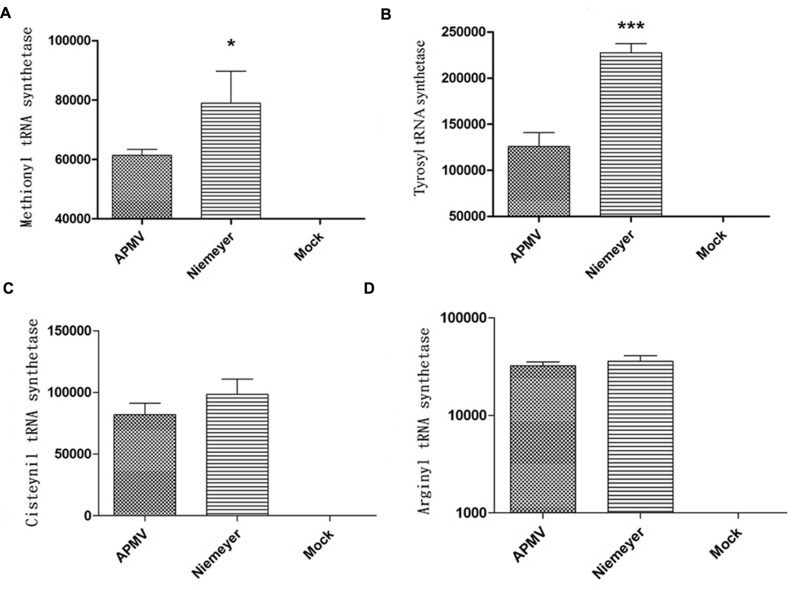
FIGURE 4.
Aminoacyl-tRNA-synthetase (aaRS) mRNA expression by NYMV. (A) Methionyl tRNA synthetase, (B) tyrosyl tRNA synthetase, (C) cysteinyl tRNA synthetase, and (D) arginyl tRNA synthetase. Relative gene expression analyses were performed using the ΔΔCt method and normalized to the expression of 18S ribosomal RNA [18S rDNA) and the viral RNA helicase mRNA (and calibrated with the lower value (=1)]. The values were subjected in different combinations to one-way ANOVA tests and Bonferroni post-tests (95% confidence intervals). Differences between groups were considered significant when the p-values were smaller than 0.05 (asterisks). Y axis represents relative abundance.

