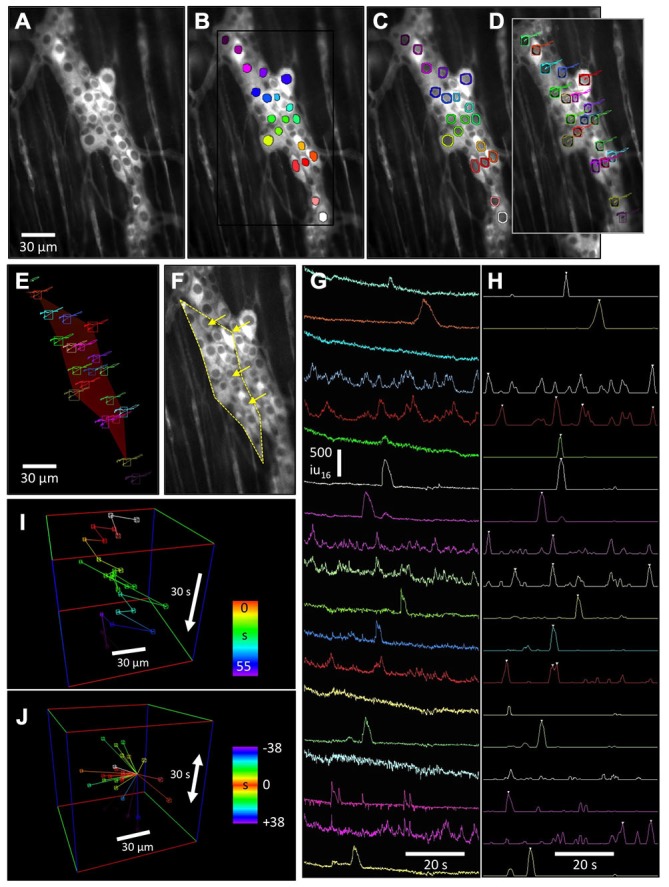
Figure 2.

Advanced motion tracking and analysis of cells labeled with GCaMP3 in myenteric ganglia. The lack of non-fluorescing landmarks in tissues prevented the use of tracking routines based on the shape and intensity pattern of a reference region. Instead, to stabilize motion associated with CMMCs, the relatively darker nuclei (vs. cytoplasm) of these cells were used to generate ovoid “nuclear” particles. (A) Fluorescence image of a myenteric ganglion from a Wnt1-Cre-GCaMP3 mouse and (B) the same image showing these particles. (C) Nuclear particles were dilated to generate rings that were used to sample Ca2+ intensity changes in the cytoplasm around the nucleus. (D) Tracking of the nuclei was achieved using a radial differential routine around the edge of the “nuclear” particle, which maximized the sum of the sampled intensity slopes calculated from cytoplasm to the nucleus. The tracked trajectories are overlaid. (E) The tracked nuclei were used to generate movement vector maps (red color of reference polygon represents a mostly longitudinal displacement) which, when reversed, could be applied to the original movie to stabilize distortion to the reference shape (F) (arrows show direction and magnitude of the distortion correction), or used to calculate longitudinal and circular micro-motions of the preparation. (G) Plots of Ca2+ intensity for each neuron were then used to identify Ca2+ transients based on the upstroke slope and duration of each Ca2+ transient to generate an event sequence (H) (white triangles). The distance and angle between neurons that fired sequentially could be represented as (I) a 3D event sequence path plot, or (J) the time and position of firing events around a particular reference cell could represented.
