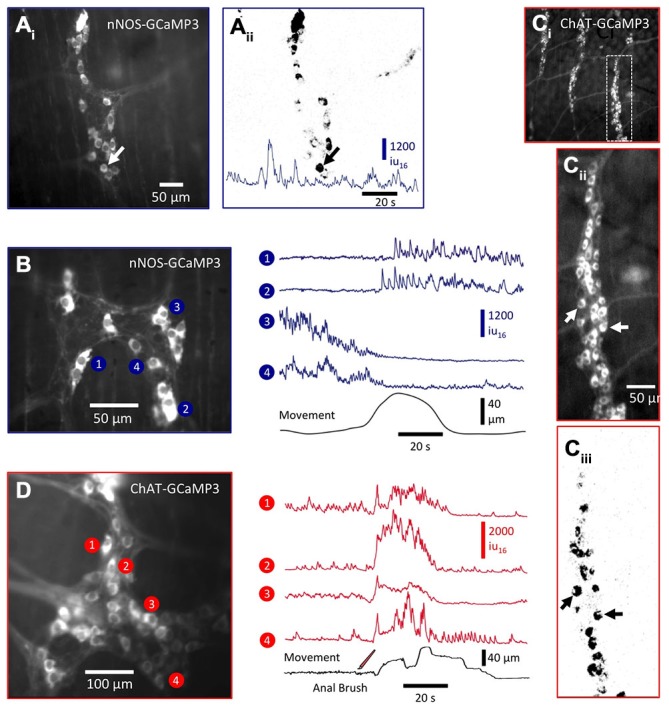
Figure 6.

Ca2+ activity in enteric neurons expressing nNOS- GCaMP3 and ChAT- GCaMP3. (Ai) Image of nNOS-GCaMP3 neurons in colonic myenteric ganglia and (Aii) an activity map of those neurons displaying spontaneous Ca2+ transients. A trace of spontaneous Ca2+ activity is shown at the bottom of the panel. (B) Image in the left panel shows another myenteric ganglia in which (right panel) the Ca2+ activity in selected neurons was plotted in relation to the distortion produced by a spontaneous CMMC (bottom trace). nNOS neurons displayed different responses during the onset of the CMMC: the top two traces show the activation of two formerly silent neurons, while the bottom two traces show the cessation/silencing of two formerly active neurons. These likely represent interneurons and inhibitory motor neurons respectively. (Ci) Low-power image of ChAT-GCaMP3-expressing neurons in multiple colonic myenteric ganglia from which the rightmost ganglia was magnified (Cii) and an activity map created (Ciii). (D) Image in the left panel shows another ganglia in which the Ca2+ activity (right panel) in selected ChAT-GCaMP3 neurons was plotted. These neurons responded with excitatory responses during the initial phase of a CMMC evoked by mucosal stimulation (three strokes; see bottom trace) and likely represent a mixed population of IPANs, interneurons and excitatory motor neurons.
