Figure 7.

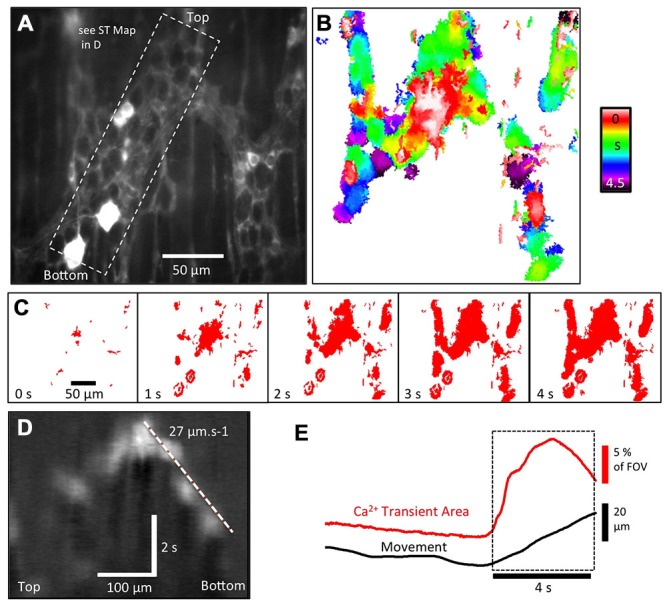
Ca2+ activity in enteric glia expressing GFAP-GCaMP3 during the colonic CMMC. (A) Fluorescence image of glial cell bodies and their extensive processes in a colonic myenteric ganglia. In addition to these glia, two neurons appear to express GCaMP3, as shown in the bottom left hand corner. (B) Colored temporal delay map illustrates that the activation of enteric glia and their processes during a CMMC was not uniform, but occurred over a period of 4.5 s in a rather “patchy” pattern. (C) Sequence of thresholded images used to generate the map in (B) revealed significant delays between the activation of different parts of the glial network in the same ganglia. (D) In some regions, the pattern of activation allowed the rate of spread to be calculated using ST maps (see dashed region in A). (E) The overall increase in GFAP-GCaMP3 Ca2+ intensity within a myenteric ganglia appears tightly correlated to the initiation of distortion (movement).
