Figure 3.
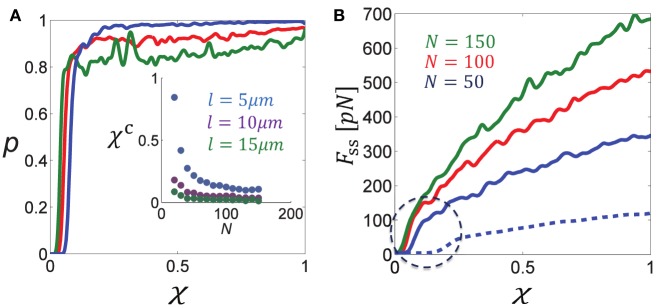
Percolation transition in cross-linked bundles of filaments. (A) Shows the percolation probability, p (of a bundle of fixed length L≈L0 to be interconnected from left to right), as a function of the fraction of active cross-links, χ, for different numbers of MTs (color coding is indicated in B). The percolation probability is seen to sharply increase to ~1 when a critical fraction χc is surpassed. The inset figure shows that χc is a decreasing function of the filament density, N∕L and length, l. (B) Shows the steady-state force, Fss, as a function of χ for different N. Solid curves correspond to l = 10 μm and the dashed blue curve to l = 5 μm. Note the sharp increase in Fss when χ surpasses the percolation threshold, χc, that is found in (A). Parameters used in these calculations: L0 = 50 μm, λfs = 10 pN/μm, k = 10 pN/μm.

