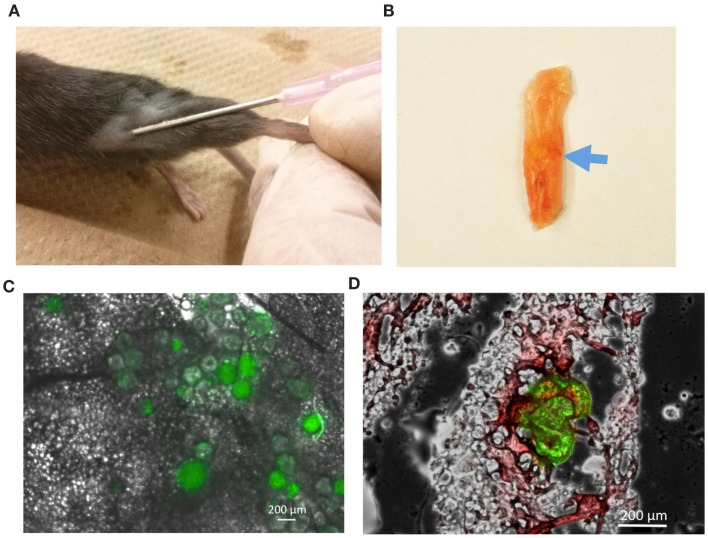
Figure 5.
Characterization of FITC-dextran-loaded microspheres following injection into mice. (A) Direct injection of microspheres into inguinal adipose depot of WT mice. (B) Injected microspheres (blue arrow) identified through gross observation of inguinal adipose tissues. (C) Fluorescent image illustrating the distribution of microspheres after 24 h of injection. (D) Representative image showing green fluorescence from FITC-dextran-loaded microspheres dispersed in white adipocytes labeled by Oil Red O staining. Green: FITC; Red: Oil Red O.

