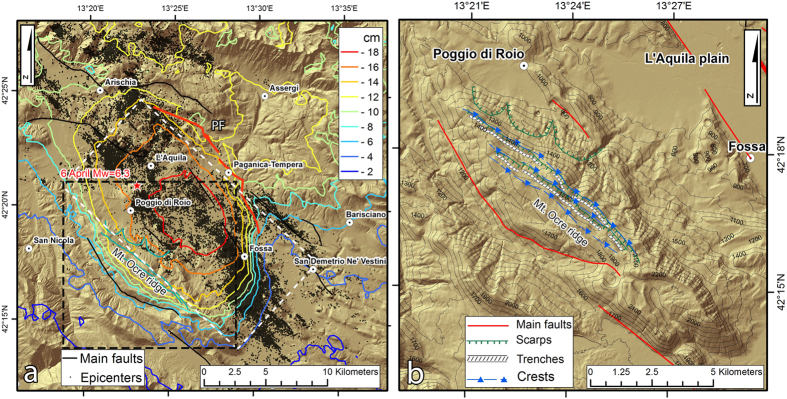
Figure 2.
(a) Detail of the study area (red box in Fig. 1a). The red star represents the location of the mainshock, and the black dots indicate aftershocks of Mw < 5. The contours identify the line-of-sight coseismic displacement pattern from the InSAR data19. The white rectangle indicates the surface projection of the Paganica fault (PF red line). (b) Detail of the Mt Ocre ridge area (black box in Fig. 2a) Maps were created with ArcGIS and Adobe Photoshop software.

