
Figure 4.
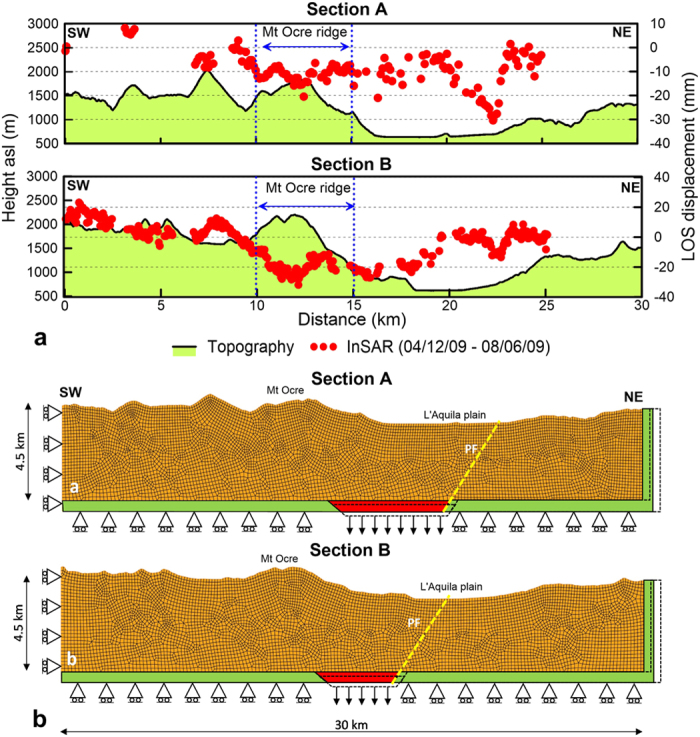
(a) Postseismic (August 6, 2010) displacement profiles for sections A and B (section traces are shown in Fig. 3a). (b) Finite element models for sections A and B (Fig. 3a). The yellow line identifies the projection of the Paganica fault (PF). The rollers constrain zero displacement normal to the boundary. The red and green bars are infinitely stiff elements; the red wedge simulates the coseismic and postseismic dislocations by moving downwards, while the green rigid support moves to the right. The dashed lines indicate the positions of the rigid elements at the end of the analysis (not to scale). Figures were created with Golden Software Grapher and Adobe Photoshop.