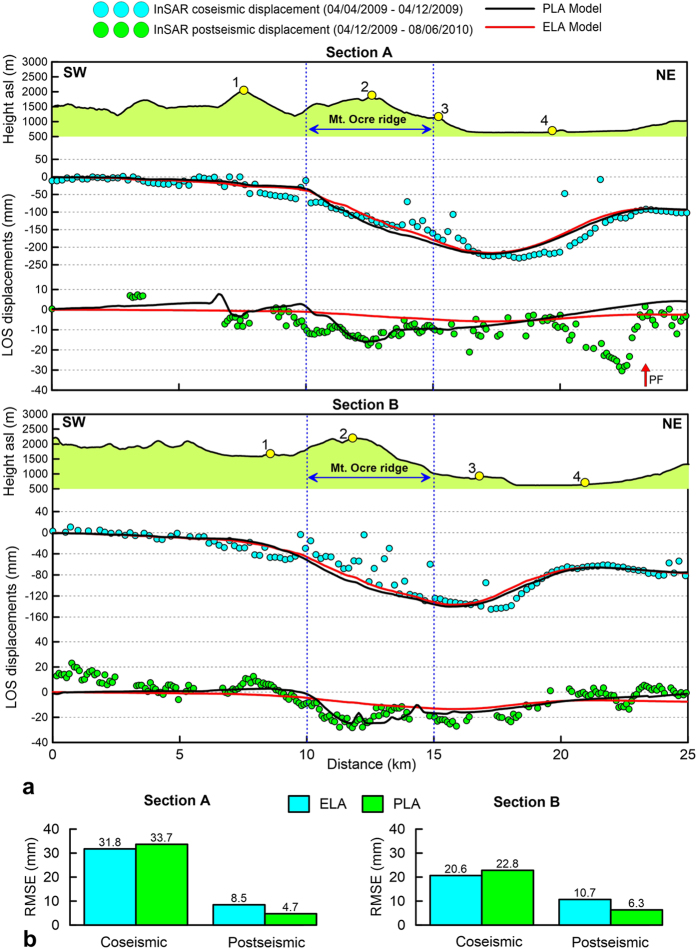
Figure 6.
(a) Observed (dots) and modelled (black and red lines) LOS CSK displacements between April 4 – April 12, 2009 (cyan dots) and April 12, 2009 – August 06, 2010 (green dots) for sections A and B. (b) RMSE of ELA and PLA models for sections A and B. The coseismic RMSE is evaluated along the whole section, the postseismic RMSE is evaluated between 10 and 15 km. Figures were created with Golden Software Grapher.

