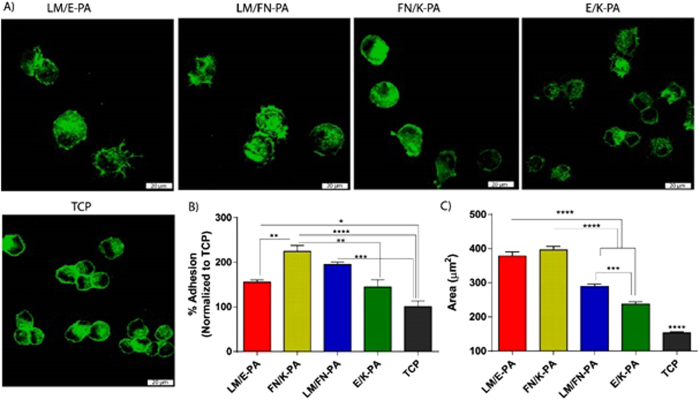
Figure 3. Adhesion and spreading of C2C12 cells on peptide nanofiber networks.
(A) Confocal images of adhered cells on peptide coated surfaces and tissue culture plate, green represents phalloidin staining and scale bars are 20 μm. (B) Relative adhesion of cells after 2 incubation in the presence of BSA and cycloheximide. (C) Quantified area from confocal images of adhered cells. Error bars represent mean ± SEM, (*p < 0.05, ****p < 0.0001).

