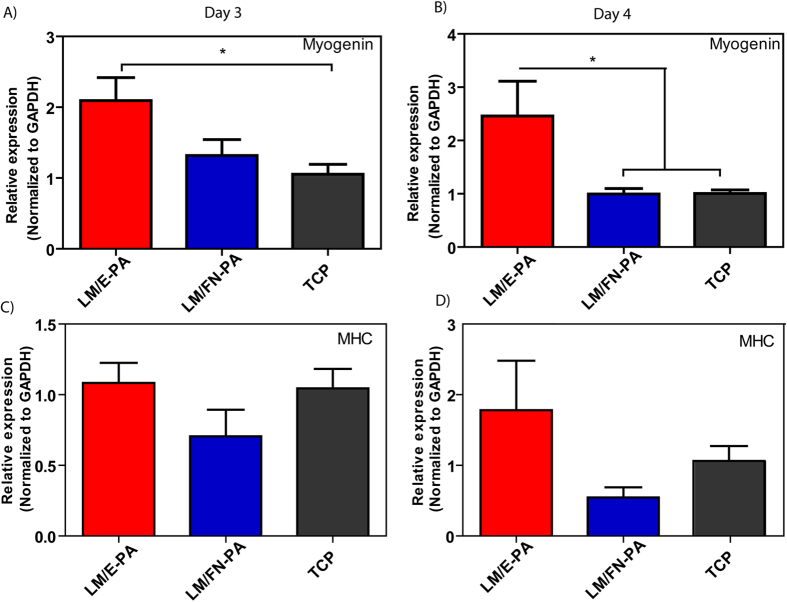
Figure 6. Gene expression analysis of C2C12 cells cultured on nanofiber networks after myogenic induction.
(A) Myogenin expression at day 3 and day 4. (B) Myosin Heavy Chain (MHC) expression at day 3 and day 4. The expression level of each gene was normalized against TCP and GAPDH was used as the internal control. Error bars represent mean ± SEM, (*p < 0.05).

