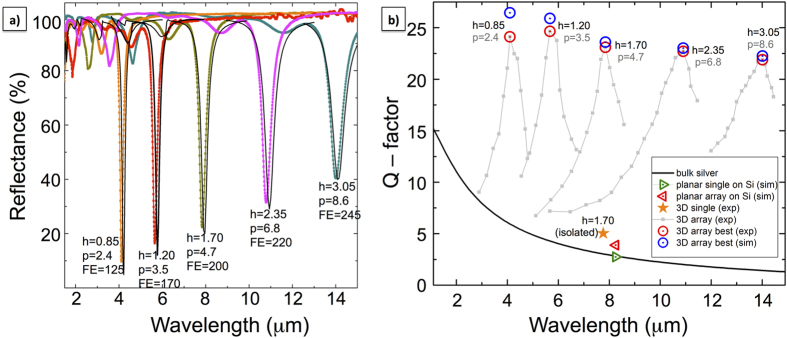
Figure 5.
(a) Best experimental FTIR reflectance plots (coloured/dotted) from arrays of silver nanotubes at different heights h: 0.85 μm, 1.20 μm, 1.70 μm, 2.35 μm, 3.05 μm. The corresponding numerical results are shown with black/solid curves. Field enhancement amplitudes (FE), extracted from simulations, are reported close to the minima. (b) Quality factors calculated from experimental curves of panel (a) as Q = λres/FWHM, together with the ones computed for 3D isolated antenna, 2D isolated antenna, a 2D array in its most performing layout (simulation geometries extracted from ref. 32) and the bulk value.

