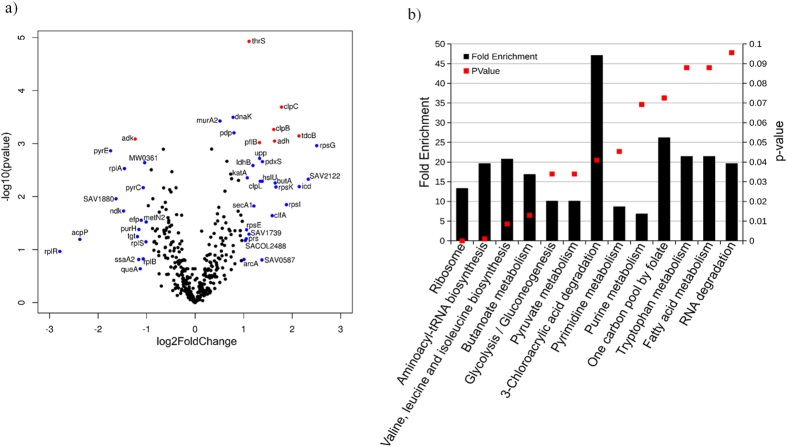
Figure 2. Quantitative proteome analysis of S. aureus cells treated with simvastatin reveals extensive protein degradation.
(a) S. aureus treated with simvastatin in biological triplicates was analyzed for changes in the global proteome in relation to untreated controls, as shown in the volcano plot. The volcano plot depicts the P-values (−log10) versus gene ratio in the simvastatin-treated group (log2). Genes marked in blue indicate an absolute fold change higher than 1. The genes marked in red represent an adjusted P-value lower than 0.05 and an absolute fold change higher than 1.5. (b) Function–enrichment analysis of proteins degraded by simvastatin were annotated using Database for Annotation, Visualization and Integrated Discovery (DAVID). The overrepresented pathways are shown in columns and their P-values are represented by the red dots.

