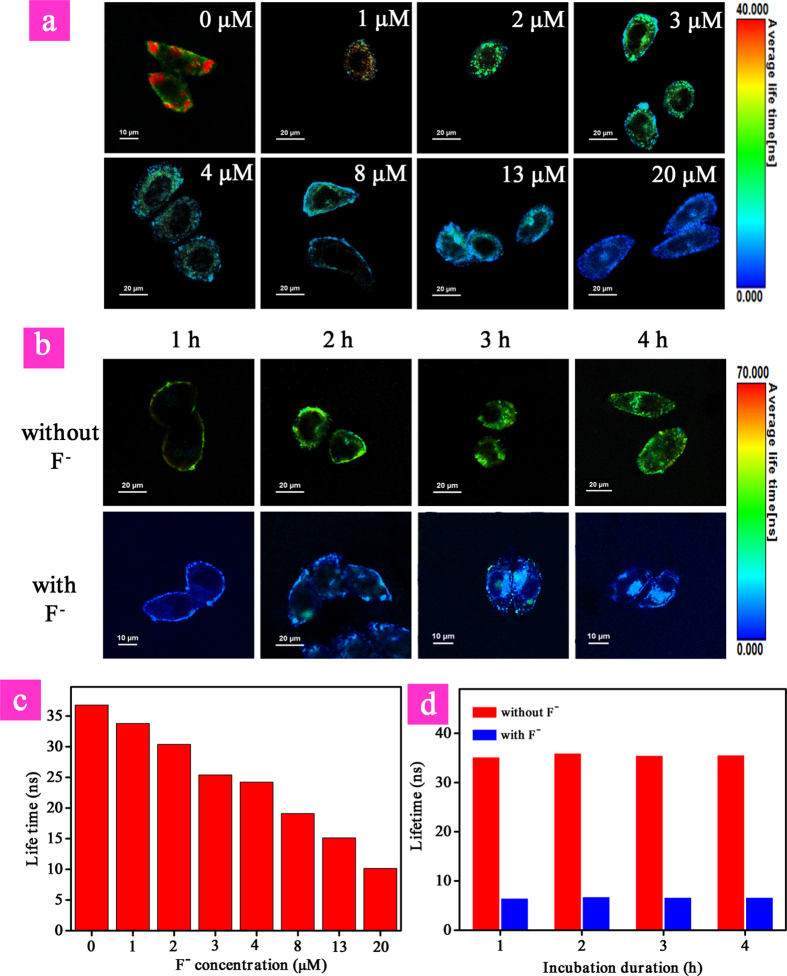
Figure 8. Photoluminescence lifetime imaging (a) and average lifetimes (c) of HeLa cells treated with P1 for 3 h in the presence of different concentration of F−.
Photoluminescence lifetime imaging (b) and average lifetimes (d) of HeLa cells treated with P1 from 1 h to 4 h in the absence and presence of 30 μM F−. Scale bar is 20 μM.

