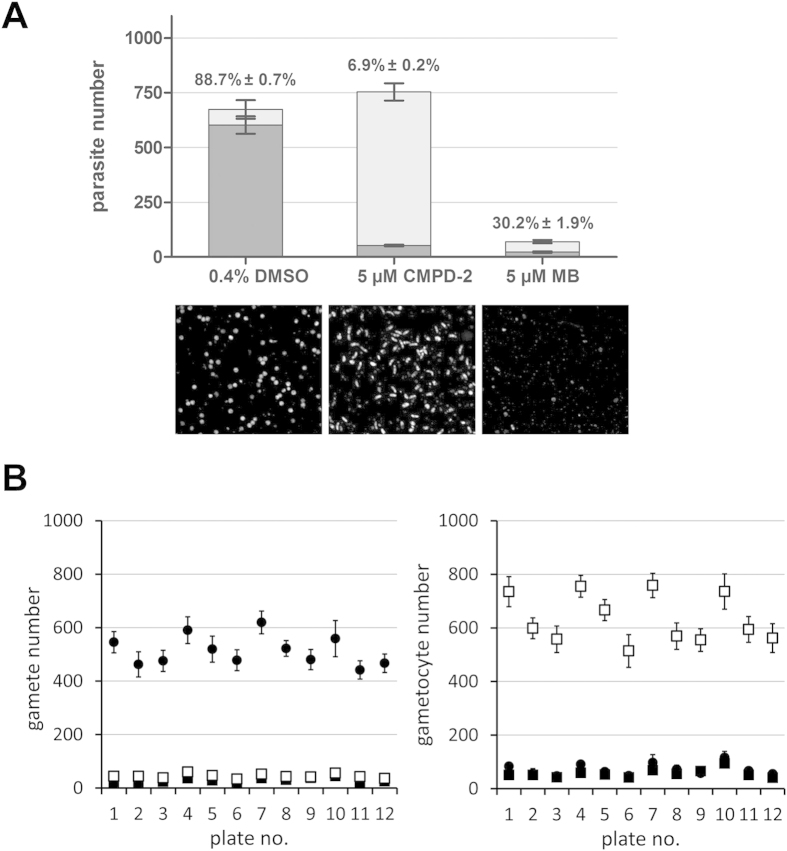
Figure 3.
(A) Quantitative comparison (n = 17) and exemplar images of positive and negative controls P. falciparum 3D7A parasite populations, obtained from the Opera High Content Imaging system. Dark bars = activated gametocyte numbers; light bars = total gametocyte numbers. Error bars represent SEM; percentages above bars indicate % rounding-up. (B) AO-GMT assay in-plate control data. Spots identified by the script as gametes (left panel) and gametocytes (right panel) in wells treated with 0.4% DMSO (closed circles); 5 μM methylene blue (close squares) or 5 μM CMPD-2 (open squares). Average numbers ± SEM. Error bars in positive controls are masked by symbols in some cases due to their small size.

