
Figure 6.
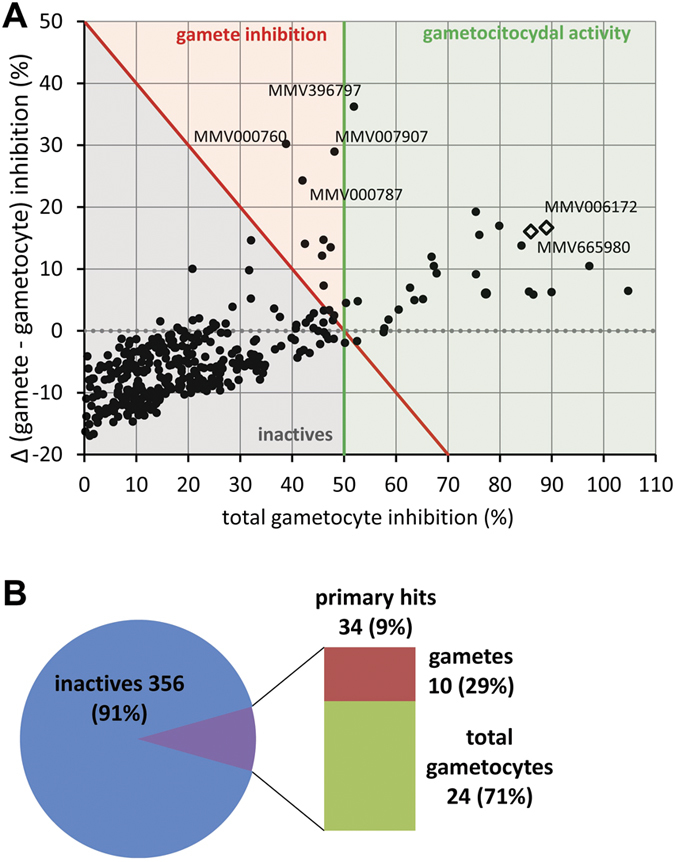
(A) Scatterplot of activity on gamete formation and on gametocytes for the entire MMV Malaria Box. Spots are total gametocyte percent inhibition values (X axis) and difference between gamete inhibition and corresponding X value (Y axis) of two biological replicates; red and green lines represent 50% activity thresholds for functional viability and total gametocytes readout, respectively. Dotted gray line indicates gamete and gametocyte inhibition equipotency. White diamonds correspond to the two compounds with the most potent gametocytocidal activity in subsequent dose-response tests. Compounds were screened at 5 μM concentration. (B) Overview of screening outcomes; see Supplementary Table S2 for the complete dataset.