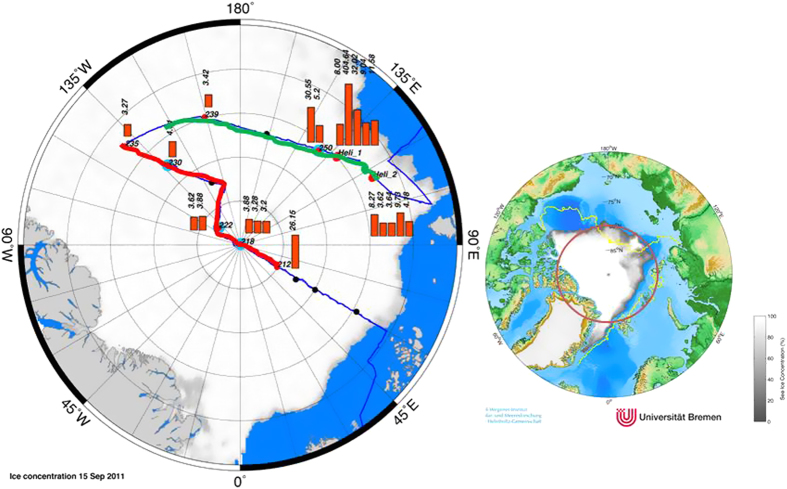
Figure 1. Right: Sea ice concentration in Arctic Ocean showing the minimum ice extent in 2011 (white/grey) and in 2007 (yellow line) from passive microwave satellite.
The red circle encloses the region shown in Figure on the left where hydrographic transects 1 (red) and 2 (green) are displayed. Left, cruise track during R/V Polarstern cruise ARK-XXVI/3 (TransArc, 2011). The background image gives sea ice concentration on 15 September 2011. Dots represent sea ice stations along the track and red bars show methane concentrations (nM) in brine samples from core holes (sack holes). Methane equilibrium is 3.5 at temperature of −1 °C and salinity of 40 (see methods). Map and plots are generated with MATLAB 2013b.

