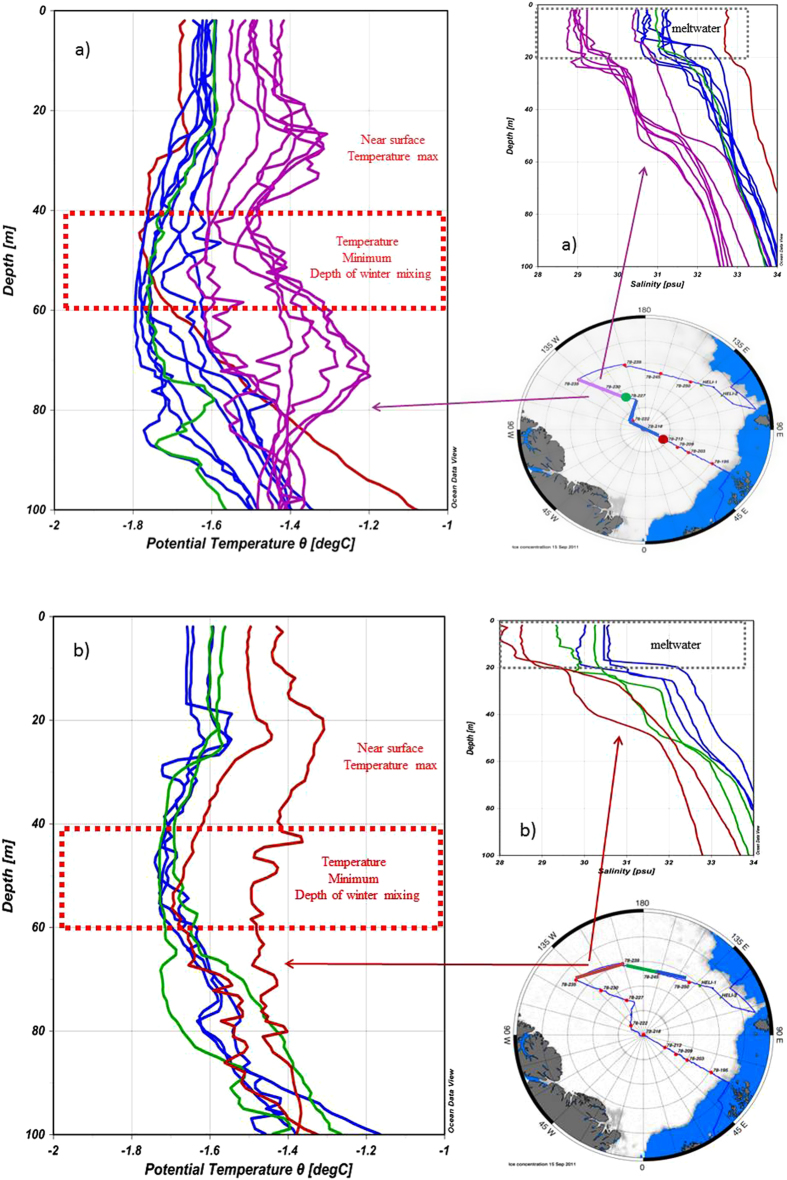
Figure 2.
(a) Temperature and salinity profiles on Transect 1. Different colours represent different sections. The red dotted rectangle shows the range of the temperature minimum, i.e. the depth of winter mixing on the stations with methane excess at this depth. The temperature minimum is formed during winter when freezing induces brine rejection and haline convection but is even sustained in summer13,14,15. The grey dotted rectangle at the salinity profiles show the thickness of the layer, which becomes fresher by seasonal ice melt and homogenised by wind mixing (Transect 2 see Fig. 2b). Bottom right: Cruise track during R/V Polarstern cruise ARK-XXVI/3 (TransArc, 2011) created with JMT. The background image shows sea ice concentration on 15 September 2011. (b) Temperature and salinity profiles on transect 2. Different colours represent different sections. The red dotted retangle shows the range of the temperature minimum, i.e. the depth of winter mixing on the stations with methane excess at this depth. The temperature minimum is formed during winter when freezing induces brine rejection and haline convection13,14,15. The weaker temperature minimum on transect 2 reflects the fact that the WML is different on the two transects. The grey dotted retangle at the salinity profiles show the thickness of the layer, which becomes fresher by seasonal ice melt and homogenised by wind mixing. Bottom right: Cruise track during R/V Polarstern cruise ARK-XXVI/3 (TransArc, 2011) created with JMT. The background image gives sea ice concentration on 15 September 2011. Maps are generated with MATLAB 2013b.

