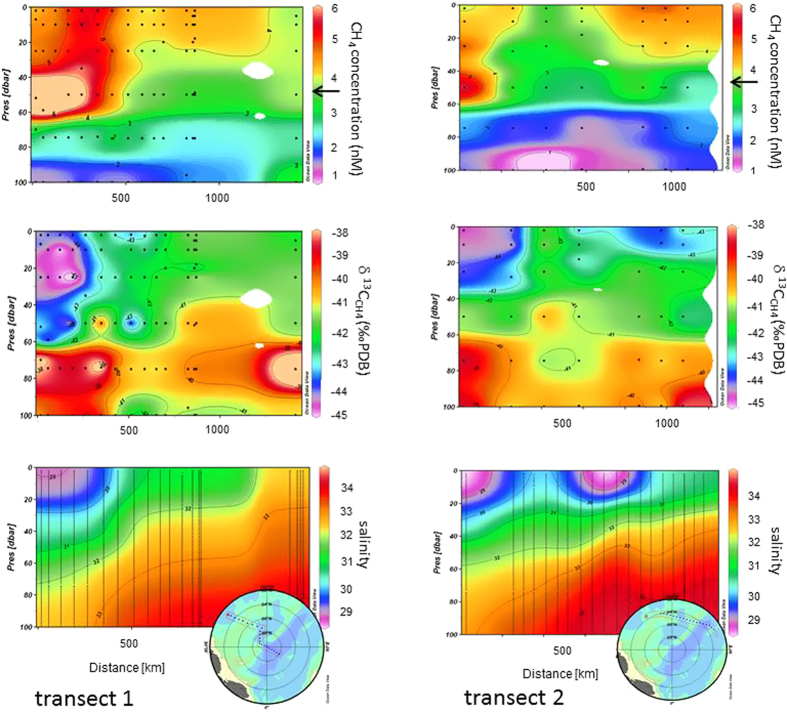
Figure 4. Methane concentration (nM), δ13C values (‰) and salinity (from top to bottom) Arrows show atmospheric equilibrium, δ13C value of atmospheric methane is −47‰.
17. Methane concentrations above the black arrow reflect super-saturation or under-saturation, respectively. Methane equilibrium concentration ranges between 3.7 and 3.9 nM and is calculated as a function of the gas solubility on the basis of the measured temperature (between −1.4 and –1.8 °C) and salinity (34 and 28) properties.

