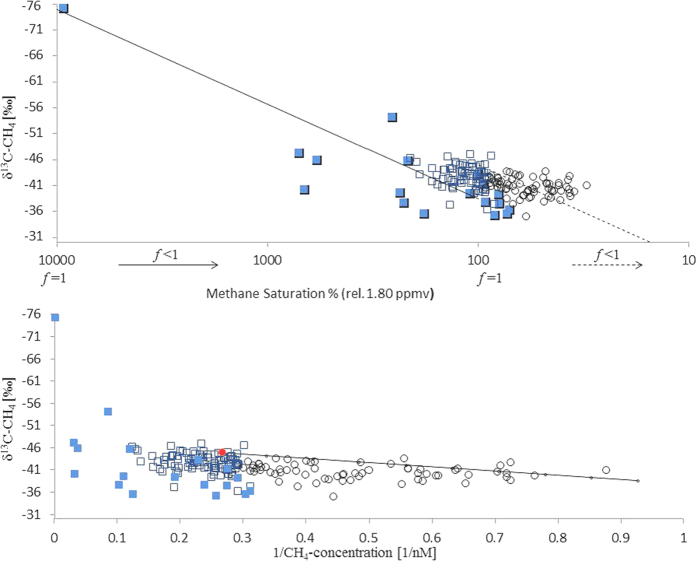
Figure 5.
(a) Measured methane fitted to Rayleigh distillation curves (RC). Methane from UHW (open circles) scatter around RC1 (dashed line) indicating the δ13C signature resulting in consumption of initial atmospheric methane. Methane from WML and MWL (open squares) and from brine (blue squares) deviates from RC1 but is localized between RC1 and RC2 (line). RC2 results due to consumption of methane depleted in 13C ((δ13CCH4)0 −75‰), i.e. the end member of methane detected in brines (blue filled squares) (see methods). (b) (below): δ13CCH4 vs. the reciprocal of the methane concentration (Keeling type plot). Red dot shows the atmospheric value. Methane from UHW (open circles) scatters around a line with two endpoints: atmospheric methane and residual methane (i.e. atmospheric methane, which has been oxidized). Deviations from the mixing line reflect the influence of on-going methane oxidation. Methane from WML and MWL (open squares) and from brine samples (blue squares) extends towards higher methane concentrations (with respect to the atmospheric equilibrium) and lighter δ13CCH4 signatures than the atmospheric value and do not fit on mixing line (see methods).

