
Figure 4.
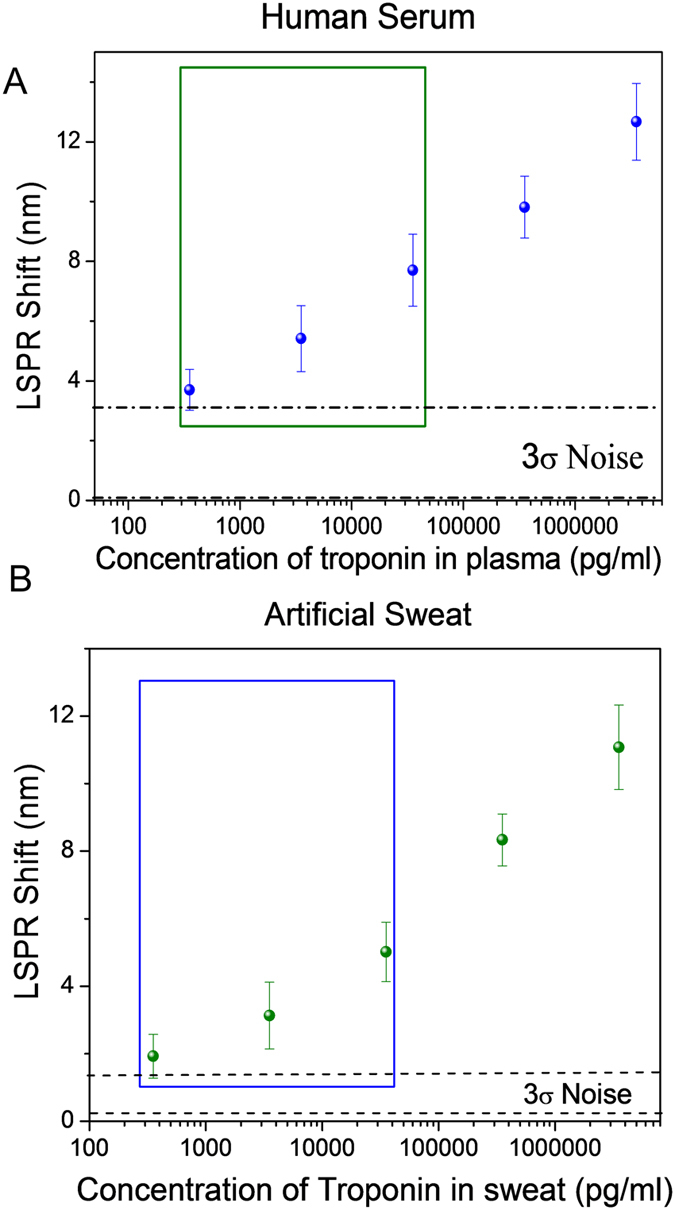
(A) Sensing calibration curve of cTnI spiked in human plasma (1/10th concentration) in buffer. (B) Sensing calibration curve of cTnI spiked in artificial sweat (1/10th concentration) in buffer. The boxed data points represent the physiologically relevant concentration of cTnI detection levels (~ng/ml concentration) over the 3σ noise level.