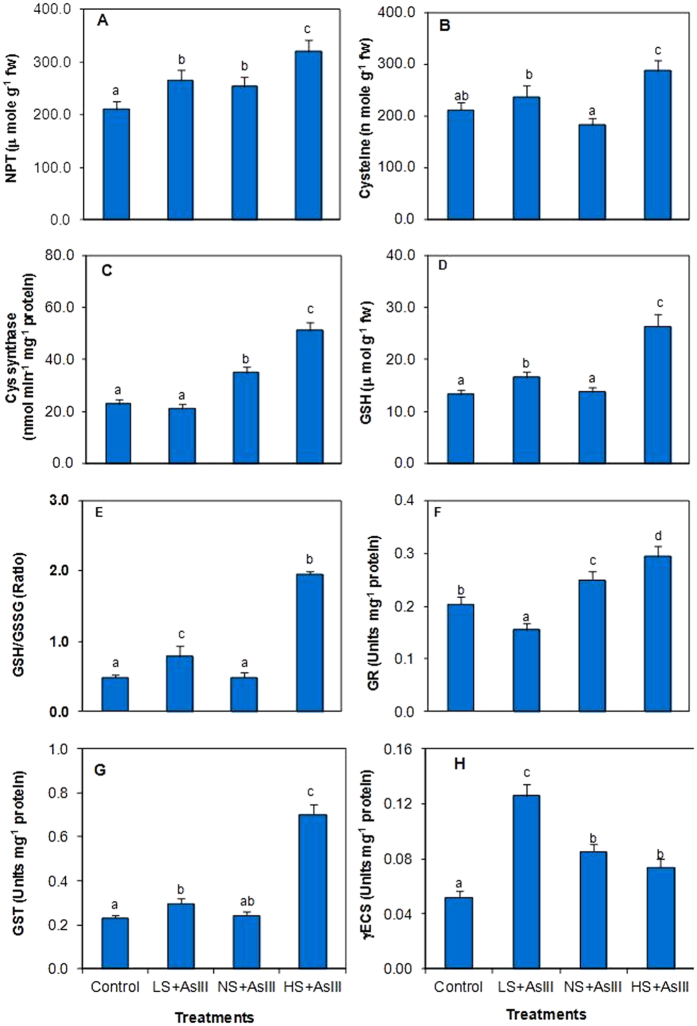
Figure 5. Effect of different S doses on the level of (A) non protein thiols (NPTs), (B) cysteine, (C) reduced glutathione (GSH), (D) ratio of reduced to oxidized glutathione (E), cysteine synthase (CS), (F) glutathione reeducates (GR), (G) glutathione-S-transferase (GST), (H) γ-glutamylcysteine synthetase (γ-ECS) under arsenite stress in rice (Oryza sativa L.) leaves.
All the values are means of triplicate ± S.D. ANOVA significant at p ≤ 0.01. Different letters indicate significantly different values at a particular treatment (DMRT, p ≤ 0.05).

