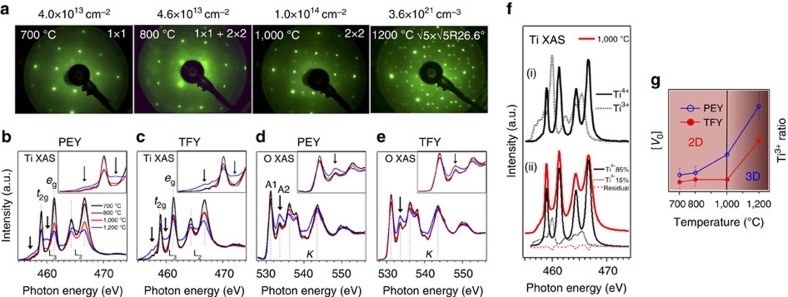
Figure 2. Creating 2D and 3D oxygen vacancies.
(a) LEED patterns with surface reconstruction labelled for SrTiO3 surfaces prepared at different annealing temperature sequentially. The corresponding carrier densities are calculated by Ti3+ ratio from PEY XAS spectra for 2D case (≤1,000 °C) and TFY-XAS spectra for 3D case (1,200 °C). See Methods for details. (b–e) Ti L2,3-edge and O K-edge XAS spectra from different surfaces. Black arrows indicate the peak intensity coming from Ti3+. (f) Top, numerically calculated XAS spectra of Ti3+ and Ti4+ ions in SrTiO3. Bottom, decomposition of experimental XAS spectra, exemplified by the PEY spectra for surfaces annealed at 1,000 °C. (g) Schematic evolution of oxygen vacancy concentration and Ti3+ ratio from PEY and TFY spectra. Vertical black line indicates the boundary between 2D and 3D oxygen vacancies.

