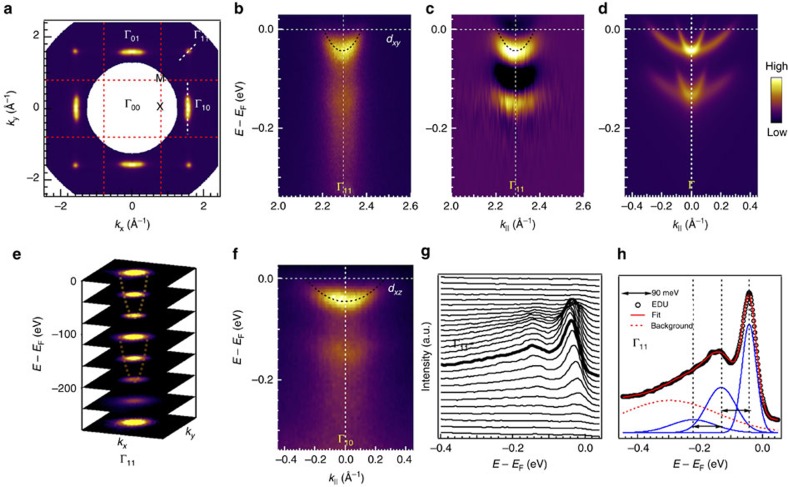
Figure 3. Observation of Fröhlich polaron spectra by ARPES at SrTiO3 surface prepared at 700 °C.
(a) Symmetrized Fermi surface of SrTiO3 in kx−ky space. Γ10=2π/a(1, 0)∼(1.61, 0) Å−1. (b) Dispersion from Γ11 along [11] direction with dxy orbital character. Dispersion from Γ10 along [01] direction with dxz orbital character is shown in f. The momentum cuts are shown in dashed while lines. (c) Energy-second-derivative image of spectra in b. (d) Simulated large polaron dispersions with dxy/dyz and dxz orbital characters. (e) Constant-energy contours of large polaron electronic structure, characterized by two (or more) similar electron pockets, indicated by dashed lines. (g) EDC stacks of spectra in b. Black empty circles indicate the EDC shown in h. (h) Franck–Condon line shape fitting. The fitted EDC (red line) is composed of three Gaussian peaks (blue line), separated in energy by 90 meV, and a hump-like background (red dashed line). Black dashed lines in b,c and f are fitted dispersions for the zero-order bands. See Supplementary Fig. 2 for details.

