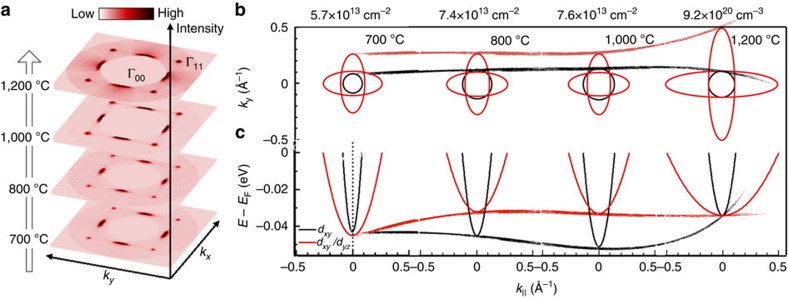
Figure 5. Evolution of Fermi surfaces and dispersions.
(a) Symmetrized Fermi surfaces of SrTiO3 in kx– ky space for (001) surfaces annealed at different temperature. The raw data is shown in Supplementary Fig. 5. (b) Fitted FSs for all the three orbitals. The calculated carrier densities are shown for corresponding FSs. See Methods for calculation formula. The superimposed red and black curves indicate the size change for dxz FS and dxy FS, respectively. (c) Fitted dispersions for different orbitals. See Supplementary Fig. 2 for fitting details. The superimposed red and black curves indicate the band bottom change for dxz band and dxy band (zero order), respectively.

