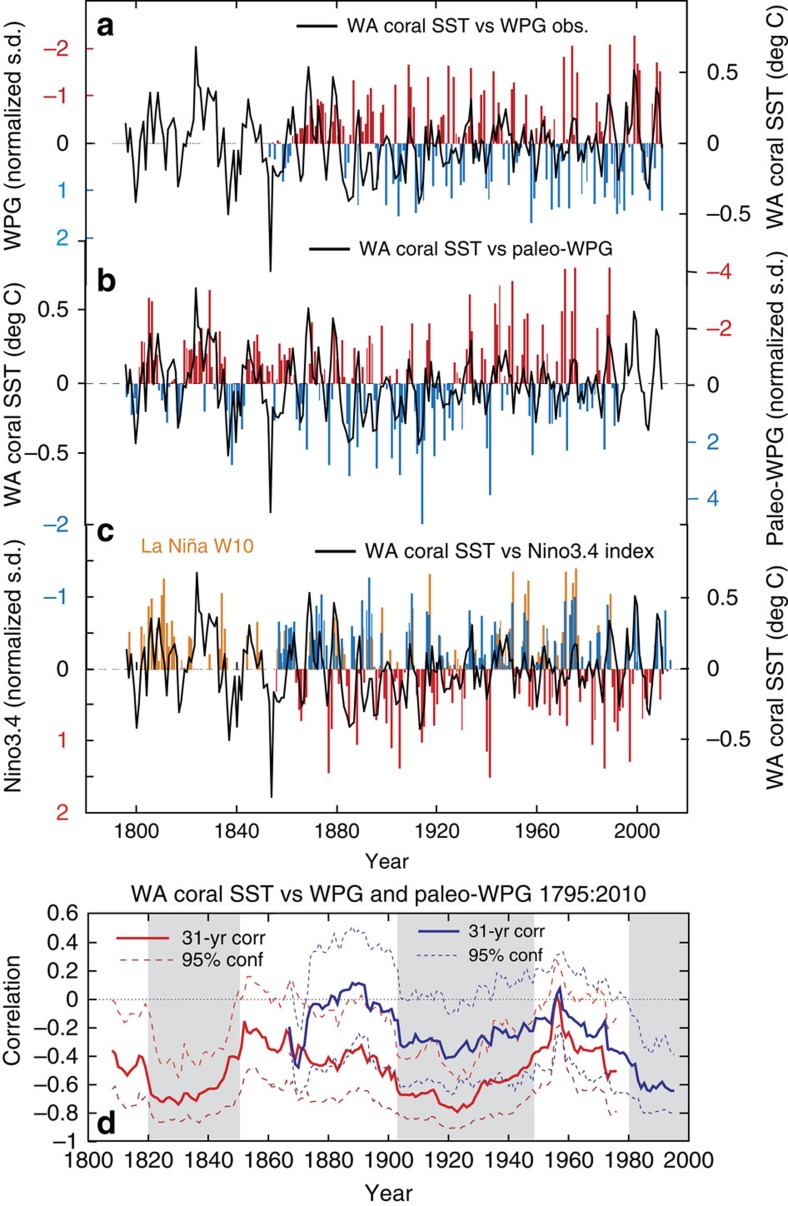
Figure 3. Western Pacific Gradient—SEIO SST relationship.
(a) WPG from observations (y axis inverted) compared to detrended WA coral SST, (b) paleo-WPG based on the difference between IWP06 (ref. 26) and Niño3.4 reconstruction28, (c) Niño3.4 instrumental index (blue= La Niña; red= El Niño) and La Niña-like anomalies in the Niño3.4 reconstruction28 superimposed (orange), and (d) 31-year running correlations between detrended WA coral SST and paleo-WPG (red solid line, red stippled 95% confidence interval based on a 1,000-sample Monte Carlo simulation58) and WPG from observations11 (purple solid line, purple stippled 95% confidence interval). Grey shaded areas indicates periods with statistically significant correlations (>95%).

