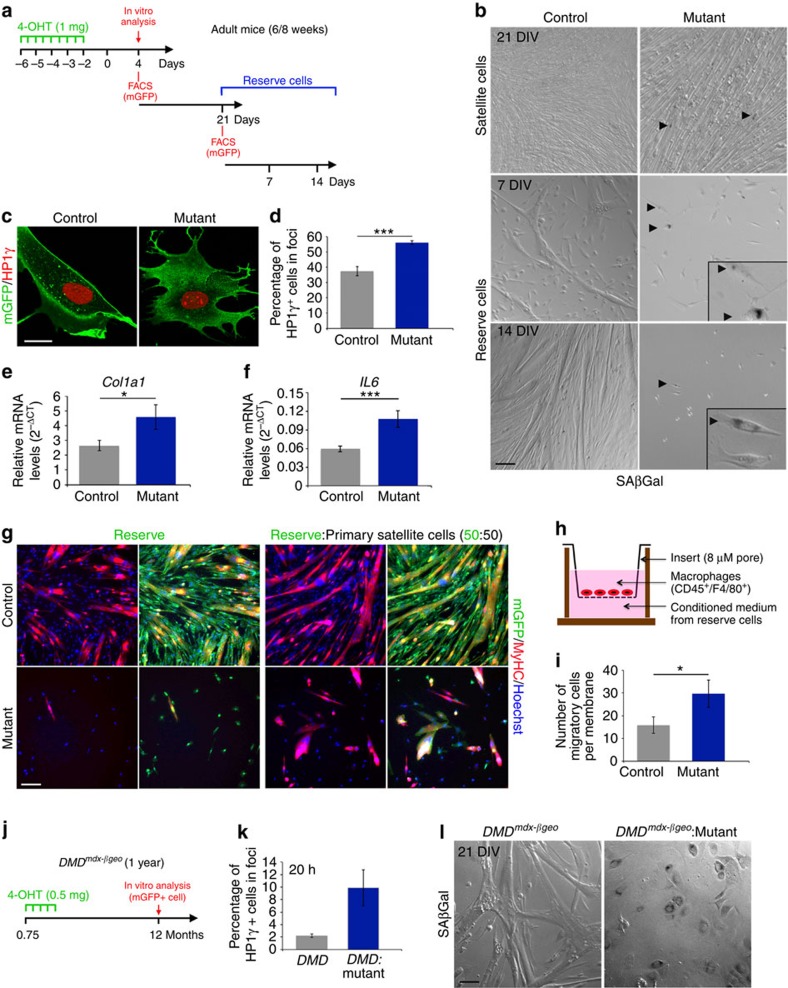
Figure 3. Self-renewed mutant satellite cells acquire senescence properties.
(a) Strategy used to obtain and examine reserve or self-renewed cells. (b) SAβGal staining on confluent myotubes derived from isolated mGFP+ satellite cells maintained 21 days in vitro (21 DIV) and on replated isolated mGFP+ reserve cells after 7 and 14 DIV. Arrowheads point to SAβGal+ cells (dark staining). Windows in left centre and bottom pictures represent high magnifications of the main image highlighting SAβGal+ cells. Data are representative of 3 independent experiments using 2 controls and 2 mutants for each. (c) Immunofluorescence using anti-GFP and anti-HP1γ antibodies on reserve cells 20 h after plating. (d) Quantification of the number of self-renewed cells with HP1γ nuclear foci as opposed to uniform staining at 20 h after plating (control n=9 mice, 37.4±2.9%; mutant: n=9 mice, 56.1±1.2%; MW P<0.0001). (e,f) Relative levels of Col1a1 (control n=13 mice and mutant n=13 mice; MW P=0.0207) and IL6 (control n=8 and mutant n=8 mice; MW P=0.0007) mRNA (2-ΔCT) in reserve mutant cells compared with controls. TBP was used as reference gene. (g) Immunofluorescence using anti-GFP and anti-Myosin Heavy Chain (MyHC) antibodies on control and mutant reserve cells (mGFP+) cultured for 9 DIV either alone or mixed at equal ratio with primary isolated satellite cells (mGFP−). Left panels represent for each condition the merge pictures of the right panels. Data are representative of 2 independent experiments using 2 controls and 2 mutants for each. (h) Scheme of the migration assay of the macrophages. (i) Quantification of the number of macrophages that migrate through the transwell membrane (control n=7 mice, 15.8±3.6 cells per membrane; mutant n=7 mice, 29.7±6 cells per membrane; MW P=0.0186). (j) Scheme used to study DMDmdxβgeo satellite cells in vitro. (k) Quantification of the number of satellite cells with a nuclear localisation of HP1γ in foci at 20 h after plating (control: n=2 mice, 2.2±0.3%; mutant: n=2 mice, 9.9±2.9%). (l) SAβGal staining on satellite cells isolated from 1-year-old DMDmdx-βgeo mice and cultured 21 DIV. Note extensitive SAβGal staining in Numb:Numbl:DMDmdx-βgeo mutant cells compared with controls. Quantifications are presented as mean±s.e.m. Scale bars b,g,: 50 μM, c: 10 μM, l: 33 μM.

