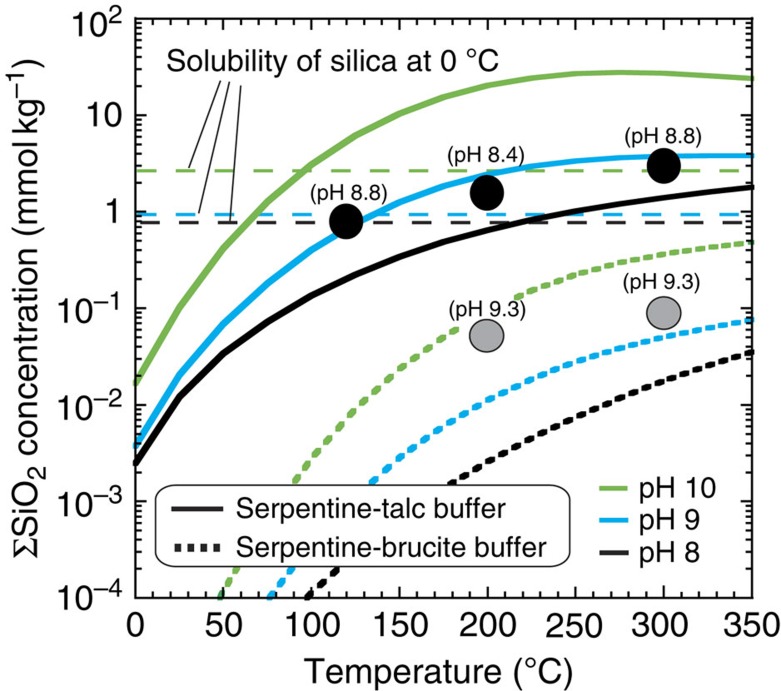
Figure 2. Experimental and calculation results of dissolved silica concentrations.
Results of ΣSiO2 (=SiO2(aq)+HSiO3−+NaSiO3(aq)) are shown as a function of temperature at variable pH. Black and grey circles are the measured ΣSiO2 in fluid samples of the opx and olivine experiments, respectively. The results of total silica concentrations in the opx experiments are also given in ref. 5. The numbers annotated to the experimental data are the calculated in situ pH values (see Methods). Solid lines are ΣSiO2 values in chemical equilibrium at 400 bars according to the following reaction between serpentine and saponite/talc (serpentine–talc buffer): serpentine+2SiO2(aq)↔talc (saponite)+H2O. Dotted lines are ΣSiO2 values in chemical equilibrium at 400 bars according to the following reaction between serpentine and brucite (serpentine–brucite buffer): serpentine+H2O↔3brucite+2SiO2(aq). The concentrations of HSiO3− and NaHSiO3(aq) were calculated for different pH values and at a constant Na+ concentration (100 mmol kg−1) using the equilibrium constants of the following reactions: SiO2(aq)+H2O↔HSiO3−+H+ and HSiO3−+Na+↔NaHSiO3(aq). Horizontal broken lines show the solubility of amorphous silica at 0 °C and 100 bars for each pH value.

