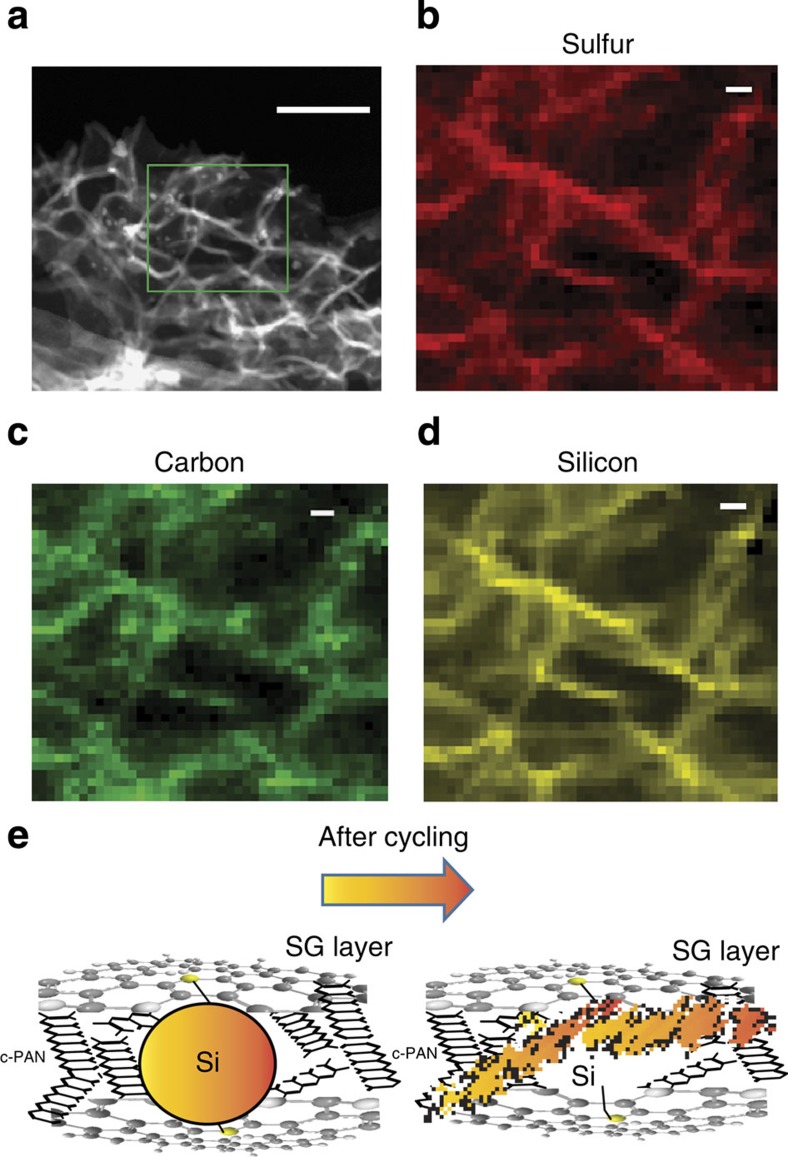
Figure 6. Characterization of SG–Si electrode material after cycling for 2,250 cycles.
(a) HAADF–STEM image of the SG–Si electrode after cycling, (b–d) the elements mapping by EELS for the area marked in image. Scale bar, 100 nm in a and 10 nm in b–d. Each pixel in b–d represents 3.4 × 3.4 nm. (e) A schematic representation to explain the structure change in the electrode before and after cycling. Before battery cycling SiNP are dispersed, and bond with S on surface of SG with c-PAN further connect the SiNP with SG. After battery cycling, the SiNP change to amorphous structure and spread and confine in the crinkles of SG.

