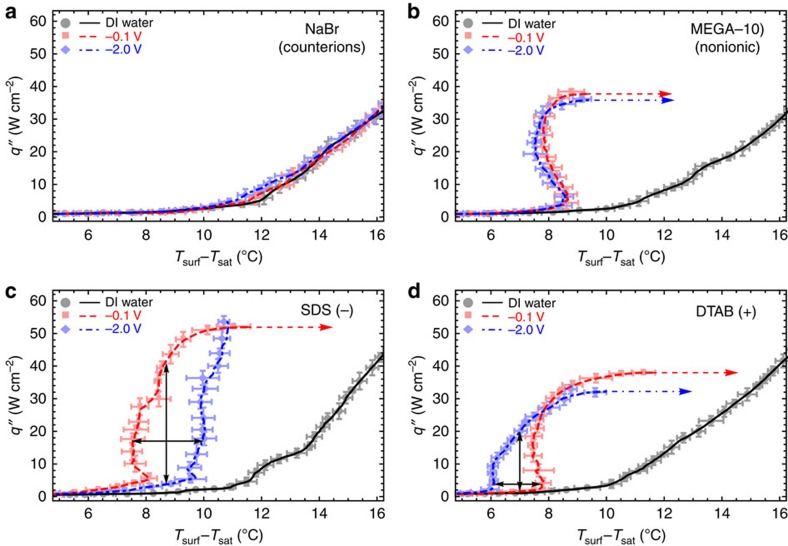
Figure 4. Boiling curves showing tunability of charged surfactants.
Plain DI water (black), −0.1 V (red) and −2.0 V (blue) boiling curves for 2.6 mM (a) NaBr, (b) MEGA-10, (c) SDS and (d) DTAB. Time averaged data points from an individual boiling experiment with error bars (2 standard deviations in data spread from time averaging) and moving averages (lines) are shown. Boiling was not affected by voltage for (a) NaBr and (b) MEGA-10. For (c) negatively charged SDS, the boiling curve at −2.0 V was right-shifted with higher CHF compared with −0.1 V. For (d) positively charged DTAB, the boiling curve at −2.0 V was left-shifted with lower CHF compared with −0.1 V. The maximum change in HTC (tunability) at constant q′′ (horizontal arrows) and constant superheat (vertical arrows) are shown for SDS and DTAB.

