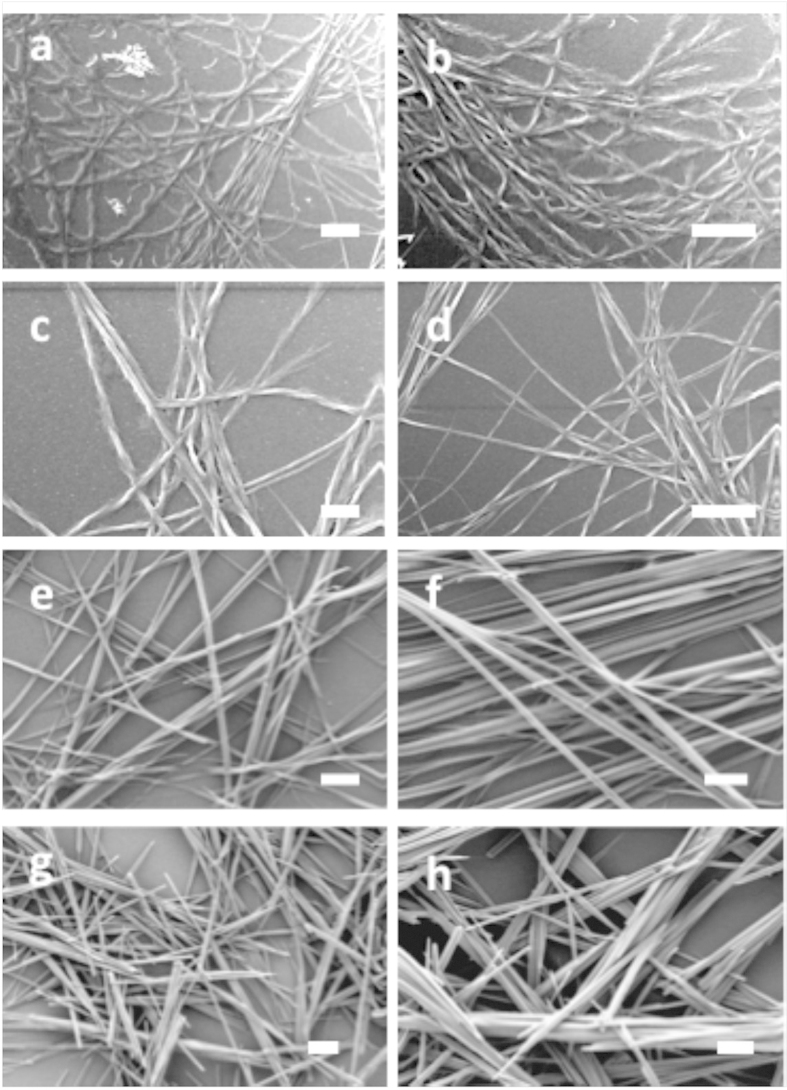
Figure 2. High-resolution scanning electron microscopy (HR-SEM) analysis of the peptide assemblies.
(a,b) xerogel formed by peptide 1, (c,d) xerogel formed by peptide 2, (e,f) xerogels formed by peptide 3; and (g,h) self-assembled aggregates formed by peptide 4. For (a,c,e,g) the solvent was hexane-ethyl acetate mixture (3:1 v/v) and for (b,d,f,h) the solvent was toluene. The scale bars are 2 μm.

