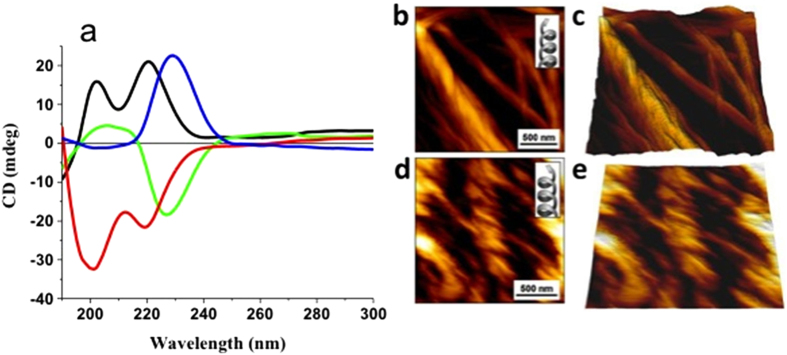
Figure 7. Supramolecular chirality inversion measurements.
Solid-state CD spectra of (a) peptide 1 in HFP (black), peptide 1 xerogel (2 wt%) in a hexane-ethyl acetate mixture (3:1 v/v) (green), peptide 2 in HFP (red), and peptide 2 xerogel (2 wt%) in a hexane-ethyl acetate mixture (3:1 v/v) (blue). AFM micrographs of peptide 1 xerogel (b,c); peptide 2 xerogel (d,e) formed in a hexane ethyl acetate mixture (3:1 v/v). The Z-scale for the 3-dimensional AFM micrographs (c,e) is 125 nm.

