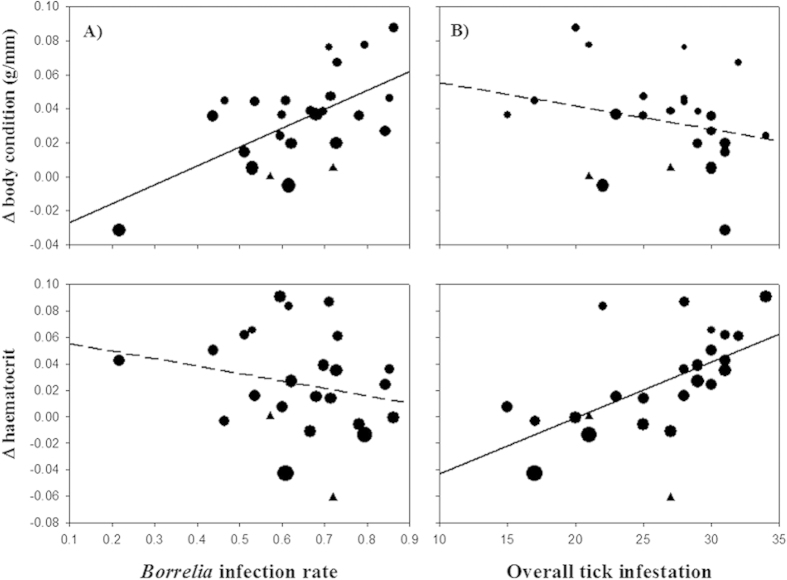
Figure 2. Changes in the health measures (Δ Cumulative, see Fig. 1) of great tits in relation to the Borrelia burgdorferis.l. infection rate (A) and overall tick exposure (B).
Least squares regression lines are fitted. Slope differs statistically significantly from zero (solid line) or not (dashed lines). The size of the symbols portrays the actual difference in the acute response between infestation 3 and 1 (Δ Acute, see Fig. 1). Triangles represent the birds that died during infestation 3.

