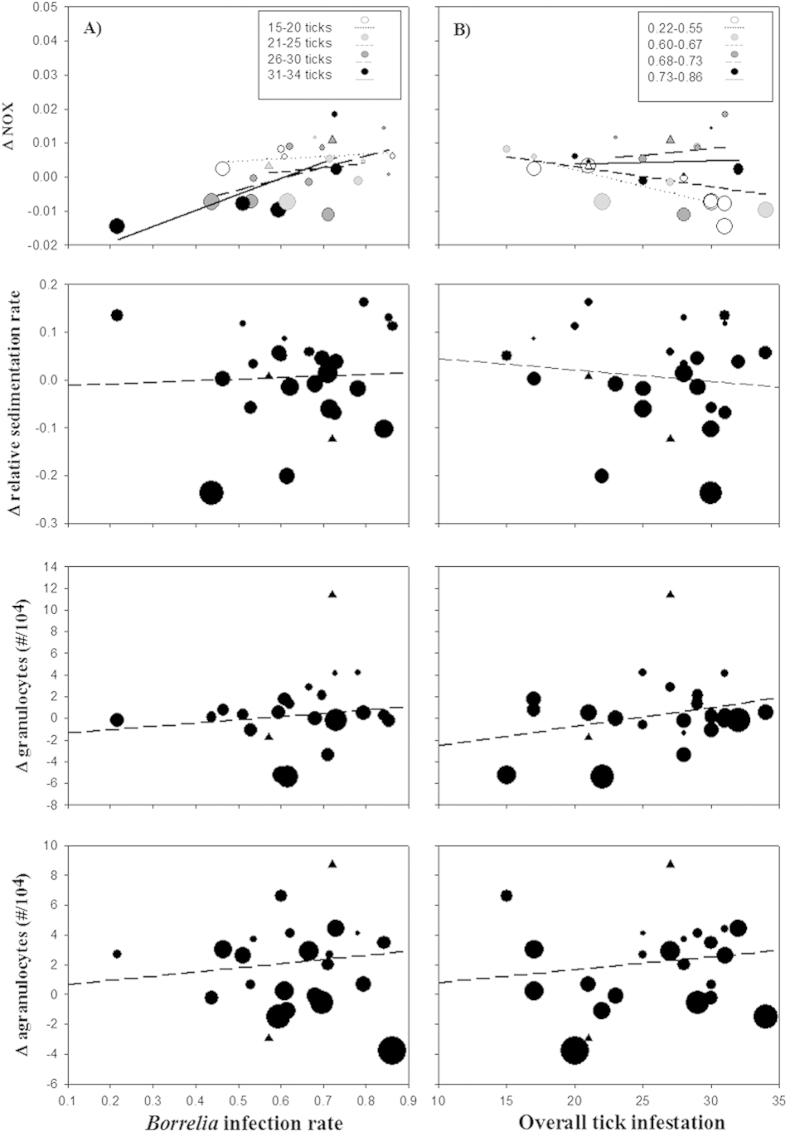
Figure 3. Changes in immune measures (Δ Cumulative, see Fig. 1) of great tits in relation to the Borrelia burgdorferis.l. infection rate (A) and overall tick exposure (B).
Least squares regression lines are fitted. Except for the presented Tick x Borrelia interaction in NOx, slopes that differ statistically significantly from zero are indicated by a solid line. The size of the symbols portrays the actual difference in the acute response between infestation 3 and 1 (Δ Acute, see Fig. 1). Triangles represent the birds that died during infestation 3.

