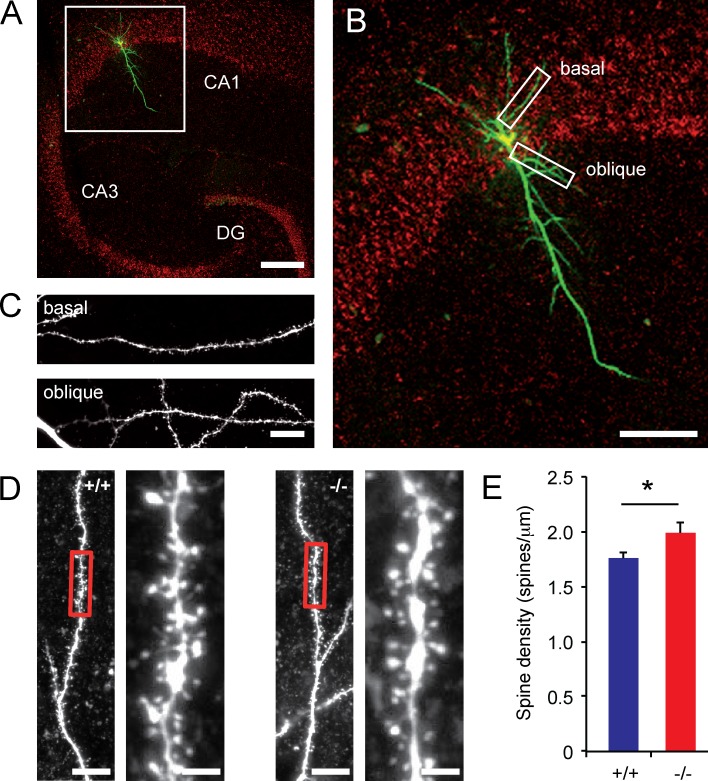
Figure 8.
Hippocampal spine densities are increased in Trim3−/− mice. (A) Example image of a hippocampal CA1 pyramidal cell filled with biocytin and imaged using confocal microscopy. Bar, 200 µm. (B and C) The first basal and the first oblique dendrite of each cell were selected for spine density measurements. Bars, 100 µm (B) and 10 µm (C). (D) Representative images of dendrite segments from Trim3−/− mice and wild-type controls. Bars, 10 µm (overview) and 2 µm (enlargement). (E) Mean spine density was significantly higher in Trim3−/− mice compared with wild-type controls (means ± SEM, two-tailed t test, *, P < 0.05, n = 6/11 cells per genotype).

