Figure 7.
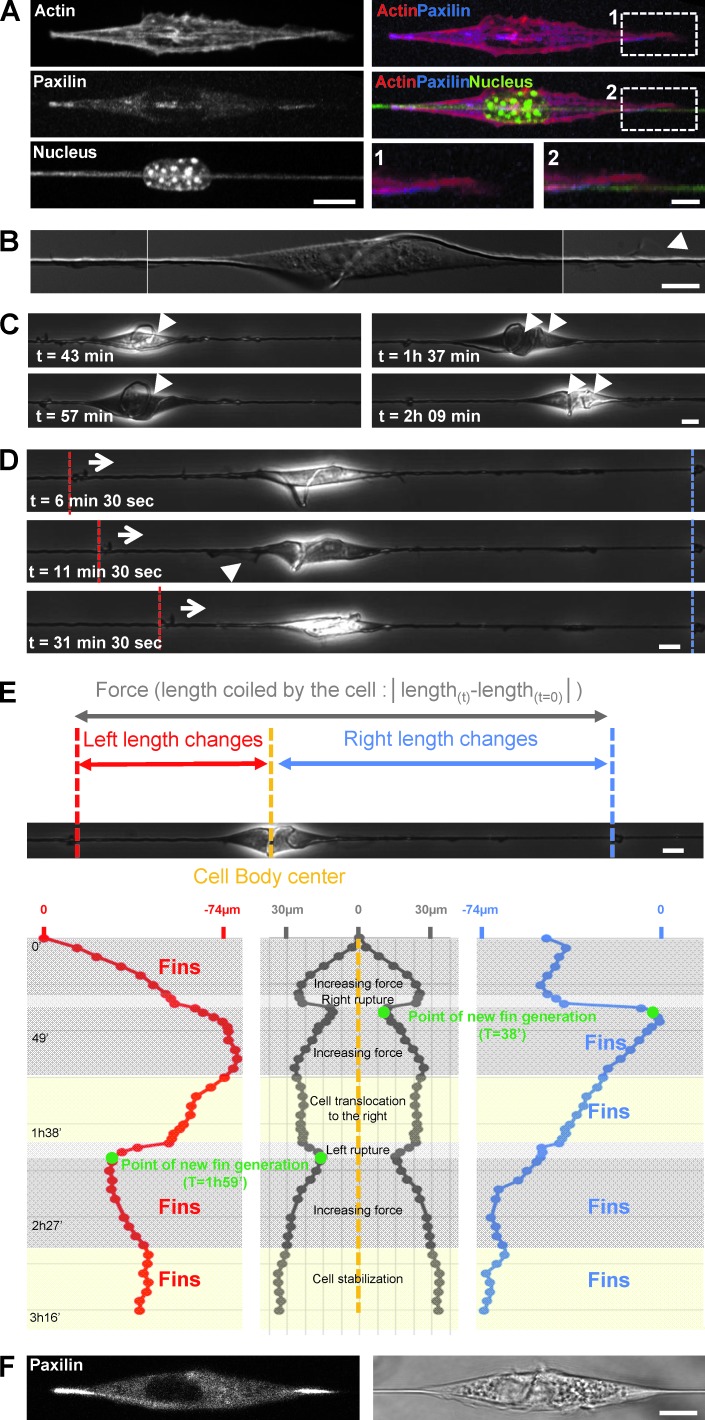
Paxilin-containing adhesions on fiber are the anchorage point for force application and matrix deformation. (A) 3T3 cells transfected with GFP-Actin (red) and RFP-Paxilin (blue) with nucleus and fiber labeled with DAPI staining (green). Bars, 10 µm and 2 µm (zooms). (B) Combined high-resolution DIC images showing the torsion of fiber and a fin (arrowhead). Bar, 10 µm. (C) Time sequence extracted from Video 8 showing fiber deformation and coiling (arrowheads, number of coils). Bar, 10 µm. (D) Fin appearance was correlated with the pulling direction (see also Video 8). In the time sequence presented, fins were on the left when the fiber was pulled inward from the left (arrows and dashed white lines) as opposed to the right (dashed red lines). Bar, 10 µm. (E) Quantitative analysis of fiber deformation by the cell presented in C and D and in Video 8. On each side of the cell the presence of small particles immobile on the fiber allowed accurate tracking of the fiber deformation induced by the cell. The red track depicts tracking of the left side deformation, the blue track the right side. In the middle panel, the overall length change between the two reference points was calculated and is an indirect estimation of the forces applied by the cell while coiling the fiber. (F) Paxillin location during fiber coiling. Bar, 10 µm.

